| Kyle Cooper, kdc1@wustl.edu (A paper written under the guidance of Prof. Raj Jain) |
Download |
Keywords: Big Data Benchmarking, Big Data Performance, Big Data Metrics, Big Data Workloads, Big Data Benchmark Challenges, Big Data Benchmark Solutions, Competitive Benchmark, Big Data
The accepted definition of what differentiates big data from other data is the three V’s: volume, velocity, and variety. The three V’s succinctly summarize properties of big data problems: they handle terabytes, petabytes, and even exabytes of information, are time critical, and cover both structured and unstructured data [1][3]. Unstructured data may be video footage, sound bites, text, log files or any other information that cannot be well integrated into a traditional relational table model. Some members of the big data community also include value as a fourth V because these are real world problems and a good solution must create value for businesses and customers [1].
A large challenge with creating a benchmark for big data systems is the wide range of problems that require big data solutions. Some of the most common applications are scientific research, healthcare, marketing, finance, intelligence, social media, and retail. It is an open question whether a single benchmark can be created that is helpful to all of these fields or whether different groups will require different measures of performance.
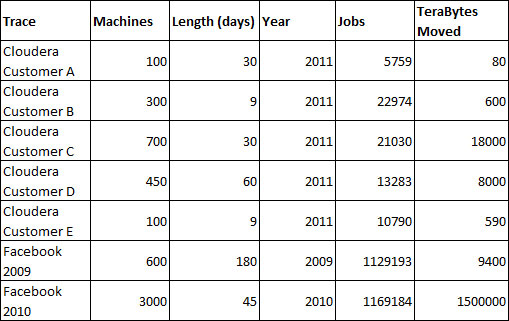
Yanpei Chen, of University of California, Berkley compiled usage statistics from companies using Apache Hadoop systems for MapReduce [2]. The data was taken from cross-industry customers of Cloudera, a big data solutions company, and from Facebook [9]. The results are reproduced below in table 1 and further analysis is provided in table 2.
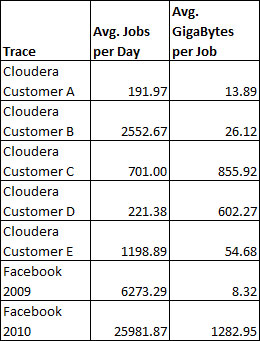
The results in Table 1 and Table 2 show the variety of big data workloads even among a small sample all running similar technologies. The number of machines required ranged from less than 100 to 3000. The average number of jobs per day varied between 192 and 25,982 while the average size of these jobs varied from 8.3 GB to 1,283 GB.
This example demonstrates how difficult it is to create a common set of needs for big data systems that can be used as a benchmark. While one group of users may be running tens of thousands of small jobs a day another group may be running several hundred larger jobs. Furthermore different users may have different priorities for how their jobs are run. While extremely accurate results may be required for a scientific analysis, less accurate results may be acceptable in a real time system to ensure that deadlines are met. Other benchmarking communities such as relational databases and scientific computing have faced these issues before and will offer insights for how to handle them.
When dealing with information on the scale of big data, it is both expensive and impractical to have a data set that systems must download and run for benchmarking [1]. Instead a benchmarking utility will need to create synthetic data. Synthetic data sets will also give greater flexibility in scaling any benchmark for different scale factors.
While synthetic data sets are commonly agreed upon as the right approach for benchmarking big data, the nature of these data sets is a more challenging issue [4]. The second V in the three V’s definition of big data is variety. Different real world data sets may contain certain properties and complexities that other sets do not and vice versa. This is especially true for unstructured data, which the International Data Corporation (IDC) predicts will account for 90% of all data generated over the next decade [3]. Data generators that produce multiple genres of synthetic data will be required to benchmark a system in a meaningful way that captures all facets of the performance.
Many big data sets include information that needs to be kept secure [7]. This could be patient medical records, proprietary company information, military data, and more. These clients require a solution that not only performs to their size and speed specifications but one that also has the security to keep data private and to prevent injections of hostile data.
A system for processing big data may either handle batches of data or a stream of information [1]. For both systems reliability is important, however it is especially important for a system handling a stream of information where results are needed as quickly as possible. An example of this is would be a smart power grid where information is gathered and acted upon in real time to improve supply, efficiency, and cost.
A typical big data system is a pipeline composed of different stages. Specific pipelines may vary but the basic requirements are shown in the figure below [1][5][6].
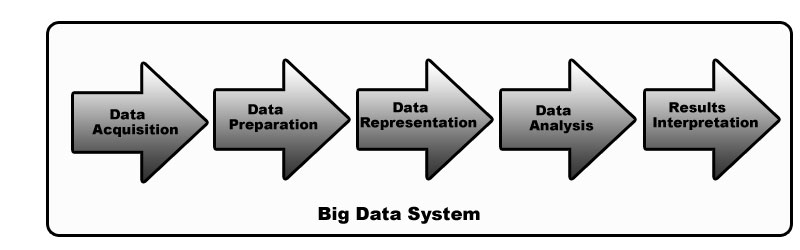
A system benchmark would encompass the entire pipeline and is thus also referred to as an end-to-end benchmark [1]. A component benchmark would measure and test only part of the system [1]. Many members of the big data community desire a benchmark for the entire system, however it is an open question whether such a benchmark can be created that is useful and practical.
A good system benchmark would allow for simple and straightforward comparisons of big data systems. All systems would be running the same tests and be measured by the same standards. From the perspective of the system designers this is advantageous as it gives them clear goals to aim for. It is also advantageous for the consumers of big data systems because it gives them a clear picture of how a system will perform instead of trying to piece together component benchmarks or compare results of different tests or procedures.
There are two main drawbacks to end-to-end system benchmarks: they are hard to specify and they are hard to deploy. Big data is still evolving quickly and one argument is that we don’t have a good enough understanding of the field to create a single benchmarking tool [2]. Trying to encompass all systems under one benchmark may unintentionally constrict some areas of big data development if they are poorly represented in the specification. Then there is the challenge of trying to make this benchmark run without any system independencies or biases.
The primary advantage of component benchmarks can be summarized as having greater flexibility than a system benchmark. Component benchmarks are relatively easy to specify as they are only testing one aspect of the whole system. They are easy to deploy as they only need to work with the components they are testing and not with all systems.
The disadvantage of component benchmarks is that they do not provide the same level of useful information as a good system benchmark would. While it may be helpful to know how quickly a sort algorithm runs, it is more useful to know about the overall performance of the system. It may be the case that improving the sort performance does not improve overall performance because there is a bottleneck somewhere else in the system. A system benchmark would not have given results about the specifics of the sort it would have shown that between the two system with the new algorithm and the system with the old algorithm there is no performance improvement.
Regardless of whether the big data community chooses to implement a system benchmark or a series of component benchmarks, platform independence is very important. For a benchmark to gain support, it will need to be deployable by the many vendors and users of big data systems. Additionally, it needs to avoid any structure that lends itself to unfair advantages or optimizations in some products.
In May 2012, the Workshop in Big Data Benchmarking convened with the goal of igniting discussion and work on big data benchmarking through an open forum [1]. Members of both academia and industry participated. In total 45 different organizations were represented. They discussed many of the challenges in big data benchmarking already covered in this paper and also brought forth informal proposals about how to address these issues. For a benchmark to become successful it is critical that the workloads and metrics are chosen properly. This section includes ideas from the Workshop in Big Data Benchmarking as well as further ideas from the author of this paper.
As already discussed briefly in section 2.2, the general consensus is that a benchmark for big data systems will need to use synthetic workloads. A real workload is too large to be easily portable and also presents challenges to being scalable. A synthetic workload will eliminate the issue of portability, and be able to generate data sets at any scale.
The challenge for synthetic workloads is to be representative of the types of data that are created in the real world and for the benchmark to capture the associated steps involved in processing them. The best way to ensure meaningful workloads is to partner with the different industries using big data and create a series of synthetic data generators that represent the different traits commonly found in their big data sets. This may be an ongoing process as big data approaches are applied to more fields and as new ways to approach big data sets are discovered.
After deciding on synthetic workloads, the next question for workload selection is how the workload should be specified. The Workshop in Big Data Benchmarking covered whether an English-based specification or a coded specification would better [1]. The conclusion was that an English-based specification is probably better. It would allow more people to understand the benchmark and to be involved in the benchmark. This is especially important because the end customers of big data solutions may not always have technical backgrounds. An English-based specification does present a difficulty though because it will need to be translated into code. It is important that the code accurately reflects what is described in English, otherwise the results of the benchmark may be misleading.
A big data benchmark should capture two broad categories: performance and cost [1]. Additionally, the information should be presented so that performance to price comparisons can be made easily. An optimal design would give one performance number per workload and accurate price information. These could be combined to get the performance to price ratio. Unfortunately this model is too simple for a big data system.
First, the performance metrics are more complicated than just the throughput of the system. It is not only speed that can affect profits but also accuracy of the results as well as error and failure rates. Customers want the ability take into account how valuable the results will be to them and how an increase or decrease in performance, both speed and quality, affects this value. For a high frequency trading firm a small increase in throughput may be the difference between large profits or business failure, but in scientific research with limited funding, paying a premium for the top end performance may not be cost effective. A social media company trying to serve a targeted advertisement to a user will most likely have a higher tolerance for inaccuracies or failures than a medical or military application where the cost of errors may be significant. Measuring complete system failure is straightforward. However, measuring errors and accuracy is not.
In many big data applications the correctness of results is not binary. For example trying to predict what movies will appeal to Netflix customers based off of the historical data from all Netflix users. A non-fatal error may occur that concludes in some movies being skipped or a movie being added to the suggestion list that should not have been. However, the results are still mostly correct and still useful. The same situation applies to system accuracy. There may be multiple systems that can generate movie predictions but use different algorithms and thus one might produce better results than the other, but that is not to say that the results from the lower quality system are objectively wrong.
This author proposes that measurements of results accuracy and quality be included in the discussion of benchmark design for big data. For some result sets accuracy may be trivial or easy to measure but for other applications, such as those involving machine learning algorithms it may be very difficult. Furthermore, checking the results of big data processing can be a big data problem in of itself. A possible solution to this is to use spot checking to estimate the quality of the results.
Similar to performance, there are multiple aspects of measuring the cost. Fortunately these are easier to define and can be verified by an audit. The components of the total cost are: the cost of the system, the cost to set it up, the cost to maintain it, and the associated energy costs. Participants in the Workshop on Big Data Benchmarking site the Transaction Process Performance Council (TPC) as having a good model for measuring costs as part of a complete benchmark [1].
The two groups who most rely upon benchmarks are marketers and engineers. However, they need benchmarks for different purposes [1]. Marketers require a benchmark that helps them differentiate their system and succinctly showcase benefits over the competitors. Engineers need a benchmark that allows them to compare different technologies at a detailed level.
When looking to market a big data solution the first consideration is that a system has the necessary functionality. After that, the next concern is the performance for the cost. The costs include not just the initial purchase and set up costs, but also the price of maintaining the system. Within a company it is generally the marketing division who funds product benchmarking so to create a successful benchmark it is important that it appeals to marketing. This type of benchmark is frequently referred to as a competitive benchmark.
As previously stated, benchmarks heavily influence engineering. Vendors will be interested in designing systems that perform well on competitive benchmarks and increase sales. However, while this pushes innovation in some areas, it may decrease motivation to innovate in new technologies that are not yet cost effective or do not fit well into the benchmark. A strictly technical benchmark that gathers detailed information with less emphasis on overall performance and cost comparison may be better suited to pushing innovation in the big data industry, which is still a new and rapidly evolving field.
The goals of sales and innovation are by no means exclusive. Maintaining competitive products often requires new technologies. Since marketing divisions generally fund benchmarking, it is more likely for a benchmark to gain popularity if it is a competitive benchmark. Then, when a competitive benchmark is widely adopted it will permeate to the engineers who will design systems with this benchmark specifically in mind. Depending on how good of a benchmark it is would allow varying levels of innovation.
For example, suppose a big data benchmark is created around the idea of comparing systems running Hadoop, because they are deemed the most marketable systems. (Several Hadoop benchmarks already exist such as testDFSIO and Terasort) [10]. It does a good job of comparing Hadoop systems and becomes popular. This benchmark will promote innovation of systems using Hadoop. However, it discourages innovation of new alternatives to Hadoop that may have other benefits but not fit well into the benchmark. On the flip side would be a benchmark that captures universal technical details, such as the number of instructions a system is processing per second, which may help engineers to compare new technologies and innovate but does not translate well into a comparison of end-to-end performance and cost for vendors and potential customers. Ultimately, the ideal would be to create a benchmark that is good for marketing while remaining broad enough and rich enough in technical details that leaves room for new technologies and gives useful feedback to engineers.
The field of big data has established itself as major entity for the future. To help vendors design better systems and customers to purchase the correct solution a benchmark utility or suite of benchmark utilities should be established. However, there is not a yet a consensus on the benchmark design, both in terms of desirability and feasibility. The Workshop on Big Data Benchmarking has taken, and is continuing to gather members of the big data community together to further discussion. While an end-to-end benchmark would facilitate the easiest system comparison, such a benchmark may not be possible while still capturing enough information. Additionally some community members raise the concern that while big data is coming into prominence, the field is still relatively young and evolving. We might not yet have arrived at a point where producing an end-to-end benchmark makes sense.
A logical next step would be to lay out specifications for an end-to-end benchmark and distribute them among the big data community for review and feedback. Then commence work on trying to implement these ideas and determining what is possible and what is not. During this time, the creation and promotion of component benchmarks should be encouraged, not discouraged. Component benchmarks may break ground in ideas that can be used in benchmarking entire systems. They will also provide a level of detail that could be useful even after a successful end-to-end benchmark is created, if and when one is. It is an exciting time to be involved in big data and promoting more discussion of how to measure, compare, and ultimately benchmark big data systems will further the growth of the industry.
Tree V’s: Volume, Velocity, and Variety
IDC: International Data Corporation
TPC: Transaction Processing Performance Council