| Edward M. Lazzarin, emlazzar@wustl.edu (A paper written under the guidance of Prof. Raj Jain) |
Download |
Keywords : social network analysis, online social networks, analysis, graphs, measurement, user interactions, overview, summary
In the last decade, Online Social Networks (henceforth, OSNs), seemingly out of nowhere, have become the central hub of remote human interaction. Facebook, the most popular OSN, is cited to have over 600 million unique users — and their principle storage system. [BUSIN11] As we enter the heyday of these massive, complex systems, academics must be prepared to analyze the staggering amounts of widely varied data for use in answering the organizational issues of the 21st century.
This paper will survey the field of OSN measurement and analysis, emphasizing recently developed workloads that have been realized to-scale. The number of different research methods, including those that have yet to be realized, is as wide as OSNs are large. One can reasonably expect the surveyed methods and results to be supplanted in the near future, although some basic results appear to be generalizable.
Section two of this paper will define OSNs, provide an example of a typical session, and then discuss a few properties, or metrics, of interest. Section three will go into greater depth regarding difficulties in studying these properties, as well as the workloads and methods used for analysis. Properties are divided into:
Section four will contain a summary of key points, and gesture toward future areas of study.
In this section, an overview of OSNs, a demonstrative OSN session, and accompanying properties of interest are discussed.
An OSN is an online system for creating and storing preserved connections between individuals, and each other's self-made content. Some OSNs focus on general, bidirectional "real-life"relationships (Facebook), whereas others focus on primarily unidirectional relationships with celebrities or institutions (Twitter). Still others center on particular kinds of user-made content, such as photos (Flickr) or videos (YouTube). Countless other forms of OSNs exist with varying sizes.
Within OSNs, users can join specialized groups, share events, play games, collaborate on projects, meet new acquaintances, keep up with old acquaintances, and more. Many networks share overlapping features, yet there are no universal (or even commonly applied) languages or APIs. On top of this, data within OSN systems is proprietary, leaving researchers with no choice but to invest in time-consuming methods for sampling and collecting data from OSNs. These factors help to create a variety of unique challenges in analyzing or comparing different OSNs.
Nearly one tenth of the world's population uses Facebook alone — a number that is expected to continue rising — and the number of applications and uses available on OSN systems has increased dramatically since the introduction of public developer platforms (spear-headed by Facebook's "Facebook Developer Platform" in May, 2007). It can be reasonably stated that the data on OSNs, if properly collected and analyzed, could contribute to the development of various fields of behavioral research, marketing, political science, education, etc. On top of this, tremendous amounts of research are required merely to maintain the efficient growth and development of these instruments and their successors.
First, and most immediately apparent, are the basic compositional properties of OSNs: the number of users and their demographics, including geographic distribution. Graphical properties, including the distribution of connections between users and the formation of communities are also of interest and instrumental in the modeling of content-flow or adoption of new applications. It is worth noting that one cannot accurately capture these properties by combining independent pieces of OSN structures. [MISLOVE01]
Seeking finer levels of detail, such as characterizing users' utilization of specific OSN functions and applications, can give insight into targets of future development, shifting cultural attitudes and social structures, and marketing opportunities. Monitoring users' shifting attention and modeling cascading content flows can allow us to predict trends of all types with a greater degree of accuracy. OSNs provide a nearly ideal form of demographic or market research: users candidly interacting with each other, in a discrete, measurable manner.
Two important properties of interest that will not be covered in this paper are security and privacy. One of the most valuable features of OSNs is the persistent storage of user behavior and the opportunities in researching said behaviors: both projects that, if handled incorrectly, can grossly violate personal privacy and compromise personal security. These issues are outside the scope of this paper.
Most OSNs require that users log in with a user name and password, via an HTTPS server. After logging in, users are presented with a home page, usually an aggregation of various content streams (i.e., Flickr's "Photostream", Facebook's "Home Feed"), notifications, and advertisements. From here, users can directly click on links to user pages, new content, messages, advertisements, groups, and more — as well as make searches for any of the above.
Once a session is complete, a user can either disconnect through inactivity, or formally log out in which case they are deauthenticated and no longer have access to many of the network's features.
The following three sections, divided according to one perspective on OSN analysis, will more deeply survey properties of interest and the methods for doing so.
Static properties, the most well-studied properties of OSNs, do not change quickly over short periods of time. These more robust properties are believed to be a product of the nature of the network, both in terms of cultural appeal and conceptual structure. For example, the degree distribution of a network characterizes the distribution of user connections to and from other users. Degree distributions are theorized to conform to the power-law distribution, demonstrated in Fig. 1. That is, the probability that a user has a certain number of connections is distributed exponentially, with very few users having massive numbers of connections, and the vast majority of users having comparatively few.
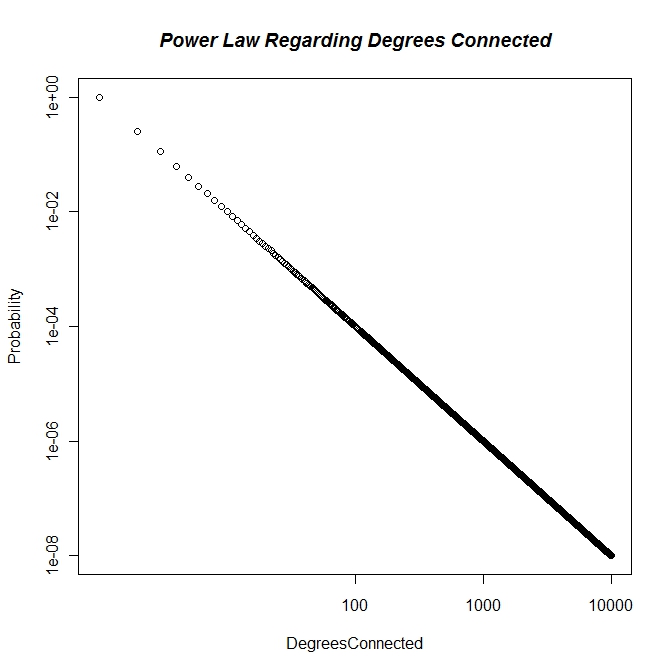
Fig. 1, Created by Edward M. Lazzarin
A number of other, similar properties conform to the power-law distribution, such as the number of inbound links to user pages on YouTube, friend links on Orkut, blog links on LiveJournal [MISLOVE01], contacts on Flickr [CHAM01], and mentions on Twitter [EDIGER]. The same is true for content produced: on each OSN, the vast majority of content consumed is created by a small portion of the population.
Betweenness Centrality or k-Betweenness is a different property that remains consistent across changes in an OSN (that is, it is robust). Betweenness is the measure of the number of shortest-path connections that pass through a given node. That is to say, if the Betweenness measure of a node is high, then many nodes' shortest path to other nodes is through the high Betweenness node. Loosely speaking, the neighborhood around the nodes of the highest Betweenness is called the Weakly Connected Component (WCC). This piece of the graph is often the subject of study in analyses of OSNs, because of the relative ease in crawling the entire piece in parallel. Calculating the Betweenness of a wide variety of nodes in an OSN, usually by crawling the entire WCC, is central to computing the most efficient paths for disseminating information.
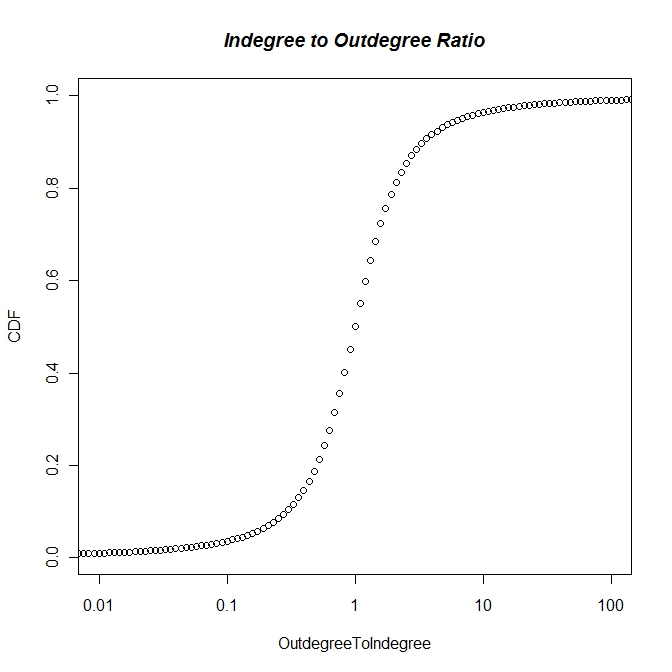
Fig. 2, Edward M. Lazzarin
The radius of a graph and its clustering coefficient (together known as small-world metrics), and the scale-free metric, are powerful descriptors of the density of a network, and the kind of clustering in networks, respectively. A common small-world metric, the ratio of inbound (indegree) connections to outbound (outdegree) connections is displayed in Fig. 2. The radius of a graph and its clustering quantify the aggregated distance between nodes across the entire graph and "how densely the neighborhood of a node is connected". [MISLOVE01] Understanding these metrics is key in exploiting the structure of a network. Further refining these algorithms, Mislove notes, would lead to improvements in "trust algorithms" for detecting fake users and spam.
The greatest difficulties in computing these metrics is in compiling massive amounts of data without bias, often through unconventional means, and then finding the most efficient means of processing. It has been proven that a breadth-first peer-to-peer search strategies overestimate connection degrees, as well as a few other metrics. [GJOKA01] The most refined direct search method, called "parallel crawling", or "parallel web crawling", employs many computers to explore separate branches of the graph (via traditional hyperlinks or OSN equivalents), combining data and rebranching when appropriate.
Parallel crawling must be done carefully, as poor search strategies can lead to enormous wastes in CPU time, or worse, produce inaccurate mergers between graphical networks. [CHAU] Additionally, there is no guarantee that a crawl will yield all nodes in the graph, although it is very likely that the WCC of an OSN will be discovered. Given random starting points and publicly released numbers about the total number of users, strong inferences can be made about the success of a crawl. [MISLOVE01], [LESOVEC01]
Along with these more theoretic concerns, crawling an OSNs suffers from the difficulties of interacting from any proprietary technology — especially one designed for privacy, as opposed to public access (e.g., Google's well-known difficulties collecting Facebook data, and relative ease collecting web data). Often, researchers will try circumvent these constraints by either obtaining direct permission from OSNs, collaborating on large measurement infrastructures (i.e., PlanetLab), or merely through enduring large experiment times and costs. [KRISHNAMURTHY] On the other hand, in some cases, proprietary technologies can be used to enhance data collection. For example, Nazir [NAZIR] creates Facebook games, via the "Facebook Developer Platform" which automatically collect user information and provide a wide variety of low-level metrics for analysts.
Mislove's seminal paper, already cited several times here, was the first large-scale application of parallel web crawling through OSNs for the computation of Static social network statistics on real world graphs. In the paper, Mislove demonstrates that many Static properties of OSNs conform to theoretical predictions. For example, the theoretical Fig. 1 above is well-supported by Mislove's data, represented by Fig. 3, taken directly from said paper, below.
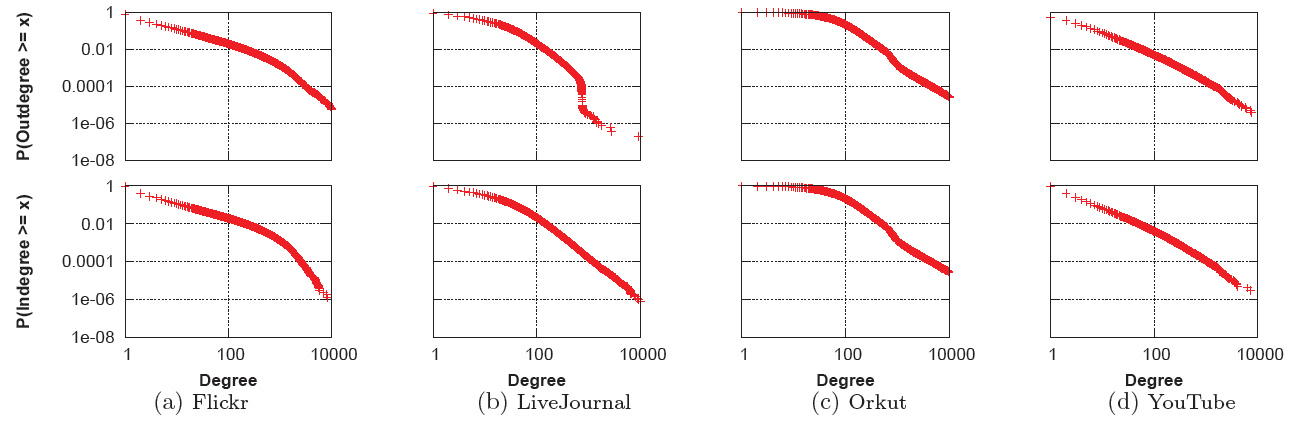
Fig. 3, Log-log plot of outdegree and indegree, CCDF
Figure copied directly from [MISLOVE01]
Another interesting result, represented in part by Fig. 4 below, comes from Nazir's research based on the deployment on Facebook applications and games. He demonstrates that, although the clustering or grouping of "friends" is ceteris paribus tight and orderly, the introduction of competitive games with social elements (as opposed to non-competitive social applications) can disrupt small group formation. The introduction of these competitive games moves consumers of said games to either persuade friends to play with them, or seek out players of the game as friends (since having friends who actively play provides in-game benefits). [NAZIR] This result, among others [KRISHNAMURTHY], demonstrates that group formation is not exclusively, or even primarily dependent on "obvious" real-world properties such as geographic proximity, institutional membership, etc.
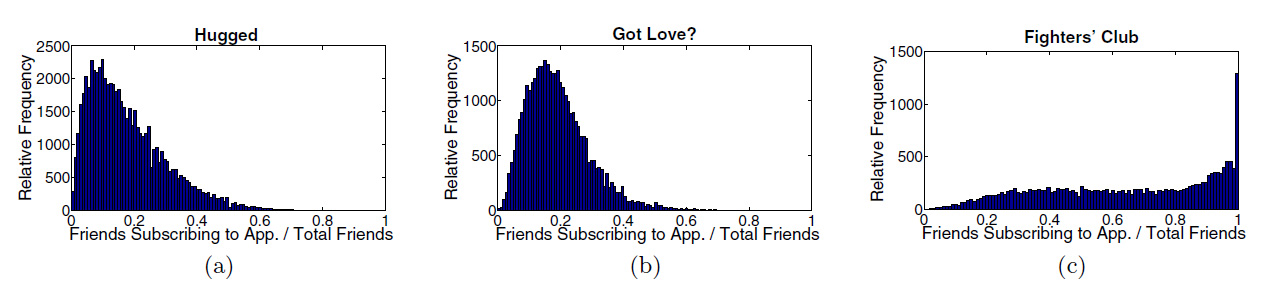
Fig. 4, This graph plots the relative frequency of users with varying proportions of "friends" subscribing to each app. In this case, "Fighters' Club" is the competitive game with social elements, where "Hugged" and "Got Love?" are social but non-competitive apps.
Figure copied directly from [NAZIR]
Dynamic properties, perhaps the least well-studied properties of OSNs, have a significant temporal component. Some Dynamic properties of OSNs include: speed of content propagation, popularity of content over time, time spent utilizing different OSN features, popularity of specific nodes, amount and nature of information exchanged between nodes, etc. [KRISHNAMURTHY] Because the quantity of information inherent in these properties is far larger than the quantity of information regarding Static properties of OSNs, both in terms of their temporal depth (many changes of short periods of time), and quantitative breadth (each user may have hundreds of friends, but thousands of messages, links, logins, button-presses, etc.), studies of Dynamic properties are often constrained to much smaller sample sizes and simpler computations.
The goal of analyzing the Dynamic properties of OSNs is usually to build a lower-level model of network behavior, explaining macroscopic properties and general trends, described by the Static properties mentioned above, in terms of systems of smaller, faster properties. In the Results section below, I will cite two excellent examples of these kinds of research.
Due to the difficulty in collecting high-resolution user data, there have been only a limited number of large-scale studies measuring Dynamic properties of OSNs. A few popular computer-driven methods include: individual subject testing (where users are asked to use a specific OSN on designated testing computers), voluntary external tracking applications, and user click streams (the tracking HTTP packets through routers at network boundaries). Surveys about OSNs use have also been deployed with limited success, as users simply cannot report their activities with the desired resolution and accuracy. [KRISHNAMURTHY]
Although the computer-driven methods vary significantly, and have different technical challenges, they all face similar obstacles inherent in OSNs. For instance, the amount of attention (or "think time") a user pays to particular features or stimuli cannot be collected directly through any technology available today. Even in optimistic circumstances, visual saccades — a common proxy for "attention" in the field of cognitive psychology — can only be measured using time-consuming, specialized equipment on a user-by-user basis.
Other issues that directly interfere with long-distance data collection boil down to the variety of methods users employ to interact with OSNs: some users prefer many "tabs" in web browsers, others may not log out for weeks at a time. Still others use browser extensions or external applications. Without direct intrusion into the software of thousands of users a time, data with limited assumptions is simply not available.
Two results, representative of the study of Dynamic properties as a whole, come from Schneider and Lesovec. [SCHNEIDER01], [LESOVEC01] Schneider collected user click stream data from routers around the network perimeter of the University of Munich. Analyzing the data yielded many interesting results about what features bring users to interact with what kinds of content, and where users are likely to spend their time conditional upon other properties. One very interesting graph produced by Schneider, displayed in Fig. 5, is a state transition graph outlining the probabilities of shifting from one activity to the next. The Dynamic nature of this kind of analysis is apparent.
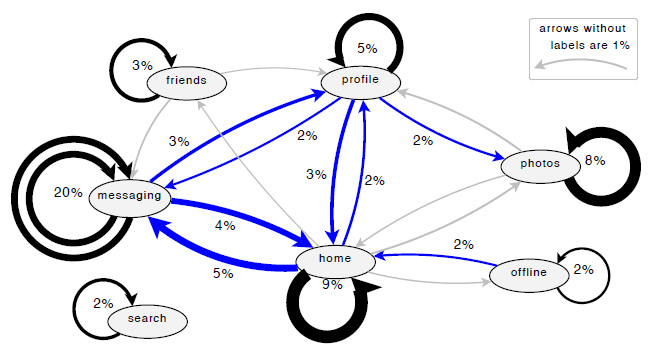
Fig. 5, This graph shows the probability of a user transitioning from one OSN activity to another.
Figure copied directly from [SCHNEIDER01]
Lesovec takes data from repeated crawls of several social networks, collected in a manner similar to Mislove, but uses it to form a general model of the Dynamic properties of OSNs. In particular, his interest is in the "evolution" of OSNs: changes in the articulation points of networks, the creation and adoption of new nodes, biases toward node ages and degrees, etc. A particularly salient result is demonstrated in Fig. 6 below, where he demonstrates the probability that a new edge (an inward or bi-directional connection) will be created conditional upon said node's age (or, more precisely, the average number of nodes created by nodes of particular ages).
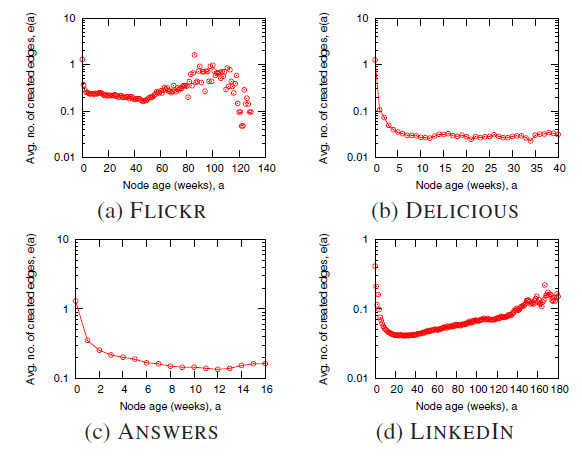
Fig. 6, These graphs, with logarithmic Y-axes, demonstrate the average number of edges created by nodes of different ages.
Figure copied directly from [LESOVEC01]
Social properties of OSNs overlap with Dynamic properties to some extent, since they are both prone to relatively quick change, and occupy more fine-grained levels of analysis. However, the two can be pulled apart by their dependence on previous social research: social properties try to use OSNs as evidence for or against various demographic or sociological theories. Data collected from OSNs can be richer, wider, and more precise than data collected through traditional means of social analysis.
Examples of Social properties include: rates of communication between different demographics, diurnal effects, rate of group membership change, and response latency between classes of "friends" (or "contacts"). These properties can be used to make inferences about group behaviors and their influences.
The primary, unique difficulty in collecting data for Social analysis is in maintaining the balance between the collection of rich data, and respecting subject privacy. Although, like in any other experiment, trivial identifiers of users can be removed (that is to say, data can be "anonymized"), OSN graphs present a unique challenge: users can be identified through connection patterns even in a static graph. Static graphs only provide what is called k-anonymity — a degree of anonymity obtained only through potential (or, through sophisticated data cleaning, enforced) ambiguities in the data. [KRISHNAMURTHY]
Two articles that capture the features of analyzing Social properties are those of [CHAM01] and [GOLDER]. Golder's paper, "Rhythms of social interaction: messaging within a massive online network", collects anonymized header data similar to that of Schneider mentioned above, but only keeps information regarding "pokes" and "messages" from Facebook. "Pokes" are simply contentless messages between two users. The content of messages is removed, and analysis is performed on information such as identity of sender, time of sending, time of response, location of sender, etc. Golder avoids serious difficulties regarding privacy by only analyzing the aggregate properties of data. Without maintaining the structure of the graph, compromising subject privacy is difficult.
Cha, in "Characterizing social cascades in Flickr", takes previously collected graph data (more specifically, a fully crawled WCC), and reanalyzes the data for a Social analysis. By following two photos introduced into Twitter at the beginning of the data collection period (100 days), Cha gathers information regarding the spread of the photo through its adoption as the "fan page" of Flickr users, among other similar properties. The property of deepest interest is called a Social Cascade. A cascade, as defined by Cha, is when a user "favorites" a photo (or becomes a "fan", on Flickr) already favorited by a contact held at the time of favoriting. In other words, because it is impossible to know exactly how a user finds a photo without extremely dense individual data, Cha makes a simplifying assumption: if you favorite a photo an already existing friend of your already favorited, you must have found it through them.
Focusing on the time-relevant elements of Facebook user messages, Golder produces numerous interesting results, one of which is the proportion of messages sent inside of schools (between members of the same school) to messages sent outside of a school. Not only are fewer messages sent during night hours, but a lower proportion of these messages are sent within schools. On the weekends, students spend more time communicating with others outside of their school, although a significant portion of messages are strictly within school.
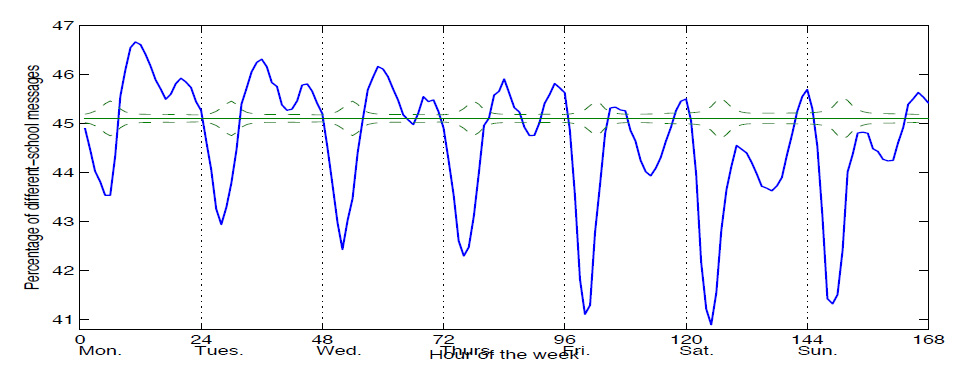
Fig. 7, This graph shows the percentage of messages sent to different schools across time of day throughout a week. The green flat line is the average proportion; the surrounding green lines represent two standard deviations from the mean, reflective of changes in total number of messages sent.
Figure copied directly from [GOLDER]
In Cha's paper, he finds evidence suggestive of cascades despite his simplifying assumption. Dislayed in Fig. 8 below, a high proportion of new fans of photographs had friends who were already fans of the photograph. Although the importance of the cascade wanes as the popularity of the photo increases, this is expected given OSN features that highlight more popular photos, regardless of the photo's status among friends (i.e., Flickr's "Explore" features). This suggests that the social component is key in spreading new content: users employ friends as filters for high-quality content, lending confiratory evidence to theories in social psychology.
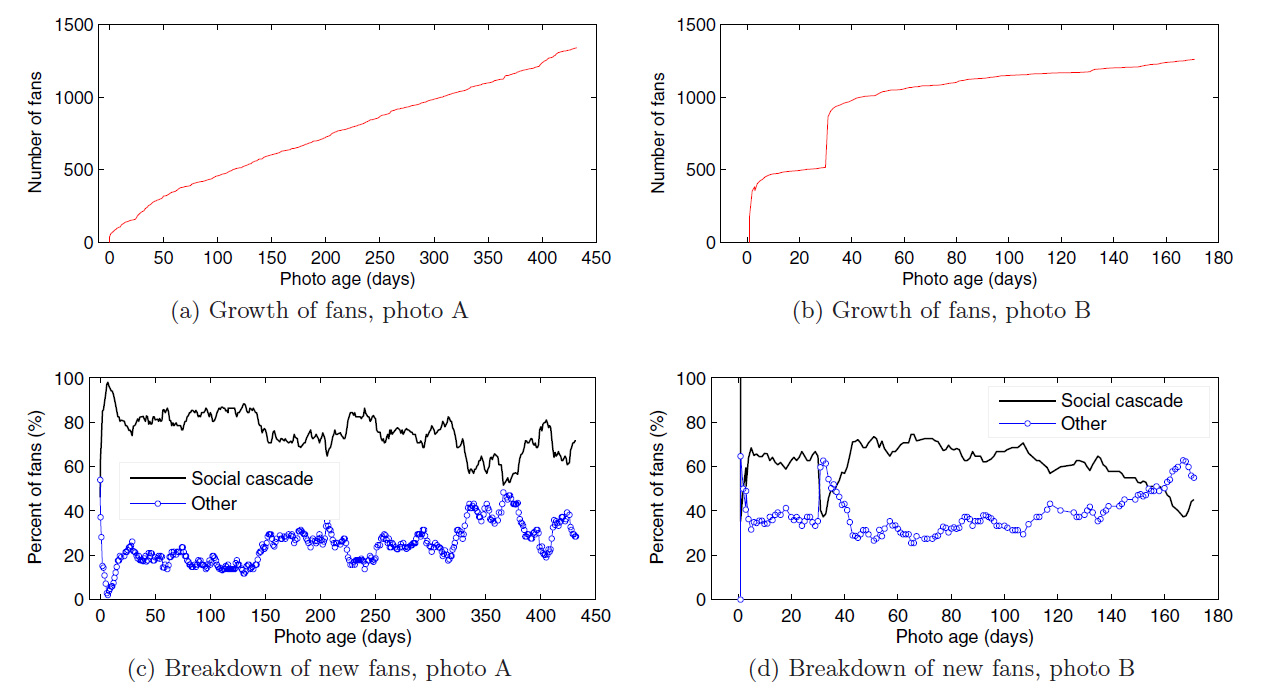
Fig. 8, The top two plots show the growth of fans for target photo A and B, respectively. The bottom plots show the portion of total fans that are part of the "Social Cascade" for said photo.
Figure copied directly from [CHAM01]
In this paper, we reviewed several classes of properties of Online Social Networks (OSNs), namely Static, Dynamic, and Social properties, and common means for measuring them. Some of these properties include the degree distribution of a network, the popularity and dissemintation paths of content, and the response latency between different demographics. Various workloads included parallel web crawling, user clickstreams, the use of proprietary network APIs. A few interesting results, including some verifications of theoretical predictions, were surveyed. The study of Online Social Networks is vast as the networks themselves, and the means of collecting and analyzing data are varied. As means of data collection improve, available computing power becomes cheaper, and our interaction with human content becomes more digital, we can expect the analysis of OSNs to become only more important and rigorous.
| API | Application Programming Interface |
| CCDF | Complementary Cumulative Distribution Function |
| HTTP | Hypertext Transfer Protocol |
| OSN | Online Social Network |
| WCC | Weakly Connected Component |