 . Packet arrivals over an interval
[t1, t2] with t=t2-t1 have a Poisson
distribution with mean tλ.
. Packet arrivals over an interval
[t1, t2] with t=t2-t1 have a Poisson
distribution with mean tλ.
Michael Wilson, mlw2@wustl.edu
Network traffic modeling is used as the basis for the design of network applications and for capacity planning of networking systems. Given the impact of poor choices in this arena, it is clear that the validity of the underlying models is of critical importance.
Most analytical queuing models of networking systems, such as switches, are driven by a mathematical description of the network traffic. The factors used to evaluate a system are taken directly from the underlying traffic model. This use requires that traffic models be both valid, resembling reality closely, and sufficiently simple as to allow queuing analysis models to reach a steady-state.
Simulations have a lighter set of requirements. Simulations are still driven directly by factors derived from network traffic models. Validity is still an important concern. Simplicity is less important. A simulation needs a distribution that can be generated efficiently, but there is no requirement that the distribution be amenable to mathematical treatment. A traffic model that allows for step-by-step generation is perfectly adequate; no steady-state solution is desired.
There are two major parameters generated by network traffic models: packet length distributions and packet inter-arrival distributions. Other parameters, such as routes, distribution of destinations, etc., are of less importance. Simulations that use traces generated by network traffic models usually examine a single node in the network, such as a router or switch; factors that depend on specific network topologies or routing information are specific to those topologies and simulations.
The problem of packet size distribution is fairly well-understood today. Existing models of packet sizes have proven to be valid and simple. Most packet size models do not consider the problem of order in packet sizes. For example, a TCP datagram in one direction is likely to be followed by a tiny ACK in the other direction about half of one Round-Trip Time (RTT) later. We do not treat this problem in this paper, but focus on inter-arrival distributions.
The problem of packet inter-arrival distribution is much more difficult. Understanding of network traffic has evolved significantly over the years, leading to a series of evolutions in network traffic models.
The oldest models were based on simple probability distributions with the assumption that these were correct in large aggregations. For example, Poisson traffic distributions (with exponential inter-arrival times) were frequently used in models (E.g., [Marathe82]). Unfortunately, this model was not very satisfactory. Real network traffic exhibited clear bursts, and the models did not. New models were proposed to generate bursty traffic [Jain86], [Heffes86].
In the early 1990s, a group at Bellcore gathered a large quantity of fine-grained, high-quality network traffic measurements. Analysis of the data subsequently demonstrated clear evidence of self-similarity [Will00]. This explained the discrepancy between traffic models and real network traffic. Self-similar traffic models are more difficult to create and analyze, and it is difficult to derive parameters for self-similar models from real network traffic. Nevertheless, several models have evolved to generate self-similar traffic [Erramilli02]. Systems have been created to simplify analysis of existing traffic to compute realistic parameters for self-similar models [Abry98].
In this paper, we will discuss network traffic models as they evolved, starting with Poisson models and moving to the “bursty” models that evolved to attempt to fix the mismatch between models and reality. Next, we will discuss self-similarity in some detail, as this phenomenon is not well-known in the networking community. After this, we will discuss the traffic models that attempt to apply self-similarity. Finally, we will close with a discussion of the overall validity of current traffic models.
Early traffic models were derived from telecommunications models [Will00] and focused on simplicity of analysis. They generally operated under the assumption that aggregating traffic from a large number of sources tended to smooth out bursts; that burstiness decreased as the number of traffic sources increased. Most particularly, the earliest models ignored bursts completely (Poisson). Later refinements attempted to add burstiness on top of Poisson distributions (Compound Poisson, Markov-modulated Poisson, Packet Trains). During this time, self-similarity was completely unknown in traffic modeling and was largely regarded as a mathematical oddity.
For each traffic model discussed, we provide an overview of the general concept, a discussion of the mathematical perspective, and a discussion of the relevant uses in modeling and simulation. The discussion of validity is deferred to the section on the advent of self-similar traffic.
Poisson models have been in use in the literature since the advent of computer networks, and before that in the telecommunications arena [Mandelbrot65]. Memoryless models are very attractive from an analytical point of view [Frost94], and with proper selection of parameters a Poisson model can be fit to most network traffic traces reasonably well for short periods.
Pure Poisson traffic models have a single parameter, the mean arrival
rate (λ). Thus, packet inter-arrival times have an
exponential distribution with mean
. Packet arrivals over an interval
[t1, t2] with t=t2-t1 have a Poisson
distribution with mean tλ.
Poisson models are popular in queuing theory because they have
attractive analytical properties: they are memoryless, meaning that
future behavior has no link to past behavior, recent or distant; and
aggregation of multiple Poisson streams generates a new Poisson stream
with λ′=Σλ. Poisson queuing models
have an easily derived steady state equation
 , where μ is the departure
rate and p0 is the probability of an empty system.
This analysis is significantly more complex in other models.
, where μ is the departure
rate and p0 is the probability of an empty system.
This analysis is significantly more complex in other models.
It has been suggested [Frost94] that the networking community has held on to the Poisson model in the face of contrary evidence because of these attractive properties.
In the compound Poisson model, the base Poisson model is extended to deliver batches of packets at once. The inter-batch arrival times are exponentially distributed, while the batch size is geometric [Jain86].
Mathematically, this model has two parameters, λ, the
arrival rate, and ρ in (0,1), the batch parameter.
Thus, the mean number of packets in a batch is
 , while the mean inter-batch arrival
time is . Mean packet arrivals over
time period t are
, while the mean inter-batch arrival
time is . Mean packet arrivals over
time period t are  .
.
The compound Poisson model shares some of the analytical benefits of the pure Poisson model: the model is still memoryless, aggregation of streams is still (compound) Poisson, and the steady-state equation is still reasonably simple to calculate, although varying batch parameters for differing flows would complicate the derivation.
One complaint with compound Poisson models is that truly back-to-back packet arrivals are rare in practice [Jain86]. This may no longer be the case. The argument in 1986 was that most network nodes were shared by nonnetwork activities, and that packet processing generally took longer than packet transmission times. Thus, the time between packets from a single node should be fairly large. However, modern CPUs are usually fast enough to saturate the outgoing network link even under nonnetwork load.
Simple Poisson models exhibit too little burstiness for realistic traffic. Particularly in the telecommunications realm, packet arrivals come in bursts (when people are talking) and pause between bursts (when people are silent). In 1986, voice and data were beginning to share telecommunications links, so research into traffic models began to consider the superposition of traffic from multiple types of sources.
The real process underlying a voice network was considered too complex to model effectively. Researchers sought a simplified model that still exhibited realistic characteristics. What was needed was a traffic model where the arrival rate varied. However, in keeping with the voice model, it made sense to vary the arrival rate in a quantized manner. The obvious solution was Markov-Modulated Poisson Processes (MMPPs) [Heffes86].
A continuous-time Markov chain determines the arrival rate in a Poisson model. The Markov chain is a two-state chain, each with an associated rate λ, and each state has a distinct mean sojourn time r, that is, an MMPP is defined by a 4-tuple (λ1,λ2,r1,r2). To determine these four parameters, a sample trace of real network traffic is necessary. The MMPP parameters are selected to match the real traffic and model traffic for the following characteristics:
Bypassing the algebra, the authors of [Heffes86] derived a means of computing these values from a traffic trace and a pair of time intervals [0,t1] and [0,t2].
This model still shares some useful characteristics with pure Poisson models. For example, if another stream with rate λ′ is added to a MMPP (λ1,λ2,r1,r2), the resultant MMPP is (λ1+λ′,λ2+λ′,r1,r2). The model can easily be extended to more than 2 states in the Markov Chain. An algebraic solution exists for the mean delay of a packet arrival, and this solution still applies when more than 2 states are used in the Markov chain. The process even allows for analytical evaluation of finite buffer situations. The evaluation process requires solving a matrix of order 2(N+1) where N is the buffer size, but this is easily within the reach of modern mathematics packages. Thus, if the model were correct, a router or switch designer could engineer the buffer size for a given level of performance by analytical means.
Unfortunately, the analytical conclusions of the MMPP traffic model were validated by simulation based on MMPP traffic generation, and the parameters were selected for voice traffic over telecommunications links. As expected, the analytical results of the model and the results of the simulation matched very closely; Poisson models were much less accurate. Given the known problems with traffic models of the era, a validation against live traffic would have been more impressive.
Another attempt at providing a bursty traffic model is found in Jain and Routhier’s Packet Trains model [Jain86]. This model was principally designed to recognize that address locality applies to routing decisions; that is, packets that arrive near each other in time are frequently going to the same destination. In generating a traffic model that allows for easier analysis of locality, the authors created the notion of packet trains, a sequence of packets from the same source, traveling to the same destination (with replies in the opposite direction).
Packet trains are optionally sub-divided into tandem trailers. Traffic between a source and a destination usually consists of a series of messages back and forth. Thus, a series of packets go one direction, followed by one or more reply packets, followed by a new series in the initial direction. The authors designate these series of packets as tandem trailers within a single train and analyze the trailer characteristics as well as the overall train characteristics.
Traffic quantity is then a superposition of packet trains, which generates substantial bursty behavior. This refines the general conception of the compound Poisson model, which recognized that packets arrived in groups, by analyzing why they arrive in groups, and better characterizing the attributes of the group. Finally, the authors clearly demonstrate that packet arrival times are not Poisson distributed, which led to a model that departs from variations on the Poisson theme.
The packet train model is characterized by the following parameters and their associated probability distributions:
The train model is designed for analyzing and categorizing real traffic, not for generating synthetic loads for simulation. Thus, little claim has been made about the feasibility of packet trains for generating synthetic traffic. Given accurate parameters and distributions, generation should be straight-forward, but derivation of these parameters is not addressed.
Unlike most models, the packet train model does not exceed the limits of the system. The authors demonstrate concretely that different types of traffic have different characteristics, largely differing by protocol. This rigorous mapping of real traffic into the model is unusual and admirable. They do not attempt to make sweeping statements about all protocols, even in the aggregate. They also do not attempt to present distributions for the parameters of the model.
Unfortunately, this makes mathematical analysis of a system difficult using the packet train model. Much more work would be necessary before this model could be used in practical application evaluation. At best, this provides a roadmap and a framework for detailed analysis. For example, a new protocol designer may be unable to determine some of the parameters of the packet train model of the new protocol without a prototype of the protocol.
Finally, the packet train model is extremely detailed — so detailed that analysis of systems may be prohibitively difficult. For example, a designer of a switch wants to know the amount of buffer space necessary to reduce congestive losses to an acceptable level. However, a complete characterization of all traffic that must be supported would be needed before the analysis could be undertaken.
Unfortunately, all of the previous traffic models suffer from the same problem: a lack of large time-scale analysis. The intuition for this is based on the idea that as we aggregate more and more traffic, the results will smooth to a single mean. This proves not to be the case.
In the early 1990s, a group at Bellcore tracked enough data to allow this analysis. The results clearly showed evidence of self-similarity in real Ethernet traffic. [Leland94] Subsequent studies by other groups confirmed the discovery in a wide range of network traffic. All previous models were shown to be invalid or incomplete.
In this section, we will first explain self-similarity, then discuss the evidence for self-similarity in network traffic, followed by the impact on Poisson models. Next, we will examine the impact of network dynamics on self-similarity, and finally a discussion of the conditions necessary for self-similarity to apply.
Self-Similarity refers to distributions that exhibit the same characteristics at all scales. For example, a self-similar network trace would look the same aggregated in 10 ms bins as aggregated in 10 second bins.
This is clearly not the case for Poisson traffic. As bin sizes increase, Poisson traffic will “smooth,” eventually reaching a flat line at the distribution mean. Truly self-similar traffic will not; it will continue to show bursts at all scales. To quote the discoverers of self-similarity in network traffic, “traffic ‘spikes’ ride on longer-term ‘ripples,’ that in turn ride on still longer-term ‘swells.’” [Will00]
In 1993, a group at Bellcore [Will00] recorded a large series of highly detailed Ethernet data. By chance, a mathematician specializing in self-similarity was available, and a complete analysis demonstrated the phenomenon beyond any reasonable doubt.
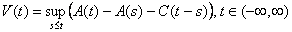
The proof is best illustrated graphically. The original study provided
the best available graphical demonstration of the problem, reproduced here
as Figure 1. On the left, we have a real network trace appearing at
different time scales. On the right, we have a pure Poisson process
generating synthetic traffic at the same time scales. The packet counts
are renormalized to an appropriate scale as the time scale changes.
The difference is clearest at the largest time scales.
![Figure 4 from [Leland94]](fig1.gif) |
reprinted with permission of authors.* |
Both Poisson processes and self-similar processes are bursty at the correct time scales. However, unlike Poisson processes, self-similar process bursts have no natural length. Bursts are evident from the 10 ms scale all the way to the 100 second scale.
Mathematically, self-similar processes are described by the Hurst Parameter, a measure of self-similarity 0≤H≤1. Then we can define self-similarity in rigorous mathematical terms as follows [Park99].
First, the Hurst Parameter denotes the degree of self-similarity. By
definition, for a self-similar process X(t), both X(t) and
 follow the same distribution for all
positive a and t. That is, after scaling the distribution
in time (and then normalizing), the distribution is unchanged.
follow the same distribution for all
positive a and t. That is, after scaling the distribution
in time (and then normalizing), the distribution is unchanged.
We are interested in a subclass of self-similar processes where the autocovariance function γ of X is invariant under translation. That is, γ(t,s)=γ(t+k,s+k). Because of this property, γ(t,s)=γ(t-s,0), and it is convenient to denote the autocovariance function with a single parameter, γ(k).
Next, let us denote the aggregation process
 of X as
 .
.
Informally, this is equivalent to widening the bins in a binning approach
to measurement, decreasing the number of bins to m. Then we can
extend the autocovariance function γ of X to
as
 .
.
A process is exactly second-order self-similar if for 
 for all k≥1
A process is asymptotically second-order self-similar if
 for all k≥1
We are most interested in the asymptotic cases. Informally, this implies that the autocovariance decreases slowly (or not at all, for exactly second-order self-similar processes) with increasing bin size. Thus, subsequent values at large scales retain some dependence on prior values even as the scale continues to increase.
Finally, we can define the autocorrelation function as  . Then for 0<H<1

and for ½<H<1
Informally, the autocorrelation decays so slowly with aggregation that no amount of aggregation can eliminate the autocorrelation within the process. This is the definition of Long-Range Dependence (LRD).
For 0<H<½, the autocorrelation decays sufficiently quickly with aggregation that we can eliminate the autocorrelation within the process. This is Short-Range Dependence (SRD) and presents far fewer analytical problems.
Poisson-based models do not adequately model self-similar processes, either in modeling traffic for analysis or in generating traffic for simulations. This can be demonstrated by theoretical arguments and experimental data.
Most Poisson models rely on the Central Limit Theorem for measurement of parameters. The Central Limit Theorem loosely states that as we aggregate more and more data from a distribution or distributions, the sample distribution will approach a normal distribution, and the mean will “smooth” toward a value. This allows easy measurement of parameters from inherently non-normal distributions.
Intuition implies that if the interval of aggregation is increased sufficiently, data correlations will eventually become insignificant by scaling. Unfortunately, the Central Limit Theorem only applies if data is independent and has finite variance. As we have already seen, self-similar traffic exhibits LRD characteristics which cannot be eliminated by aggregation.
Since all of the preceding models except for packet trains explicitly rely on Poisson processes, none of them can model real network traffic with complete validity. The MMPP model can get arbitrarily close by increasing the number of states. Indeed, a MMPP model with infinite states can model a self-similar process precisely.
Since the packet train model makes no assumptions about the distributions of inter-arrival times for cars or trains, there is no reason why this model could not adequately model self-similar network traffic. This is in contrast to assertions in [Leland94], which incorrectly assumes that packet trains only use Poisson processes. Unfortunately, no effort has been made to determine correct distributions and parameters for various types of trains.
Shortly after the realization of self-similarity in network traffic, a study [Paxson95] was published demonstrating the practical results of applying Poisson models to self-similar traffic. This study demonstrated a drastic underestimation of the burstiness of TCP traffic over multiple time scales. It also showed that while connection inter-arrival time of user-initiated connections could be adequately modeled with Poisson processes, packet inter-arrivals could not. (Machine-initiated connections are normally timer-driven and are not Poisson.)
An attempt was made to match inter-arrival times for TELNET traffic to exponential distributions. The match of geometric means was accurate only in inter-arrival ranges of 200-400 μs. Outside this range, the model made gross errors. For example, 15% of real inter-arrival times were over 1 second; the model predicted 2%. Matching with arithmetic mean was even worse; for the same data, this model predicted over 70% of inter-arrival times would exceed 1 second.
A Pareto distribution (probability density
function  ) of inter-arrival times
with β≈1 generates a very similar distribution to the real
network traffic. The Pareto distribution is not self-similar, but it
does exhibit visual self-similarity due to heavy tails and does violate
the Central Limit Theorem due to infinite variance when β≤2.
This may be a promising approach. Pareto models are simpler than truly
self-similar models, and while they do not match perfectly over very
long periods, over short periods they adequately represent self-similar
traffic.
) of inter-arrival times
with β≈1 generates a very similar distribution to the real
network traffic. The Pareto distribution is not self-similar, but it
does exhibit visual self-similarity due to heavy tails and does violate
the Central Limit Theorem due to infinite variance when β≤2.
This may be a promising approach. Pareto models are simpler than truly
self-similar models, and while they do not match perfectly over very
long periods, over short periods they adequately represent self-similar
traffic.
[Paxson95] also presents a view of the possible consequences of continuing to apply Poisson processes. Imagine an admission control system that only allows a connection to be established if adequate bandwidth is predicted. If this system relied on “recent” traffic measurements, the admission could be in error. A heavy-tailed Pareto model or self-similar model would recognize the possibility of heavy traffic after a period of low traffic.
The first network traffic models were evolved before TCP congestion control was deployed. Congestion control changes the situation dramatically. Flows are no longer fully independent, as they all react to the same triggers (network congestion).
The impact of network dynamics on self-similar processes can cause noticeable changes in the resultant models. Most traffic models, self-similar and otherwise, are open loop; that is, there is no feedback from the network to the model. TCP congestion control challenges this assumption.
The definition of self-similarity is asymptotic. Thus, while it applies over large time scales, small-scale correlations may be very different. This proves to be the case, and it is in the small scale that the impact of TCP can be seen [Erramilli02].
The study concludes that self-similarity and TCP congestion control co-exist. That is, TCP congestion control does not cause self-similarity in the network; neither does it remove or mitigate self-similarity.
Self-similar traffic models are not always appropriate. Self-similar models are most appropriate when the following conditions hold [Erramilli02]:
Even when these conditions fail us, self-similar models are not usually incorrect. They are merely overkill. Even in those cases where LRD does not exist, the model is still correct. The parameters are merely selected to yield minimal dependence (H<½).
One of the earliest objections to self-similar traffic models was the difficulty in mathematical analysis. Existing self-similar models could not be used in conventional queuing models. This limitation was rapidly overturned and workable models were constructed.
Once basic self-similar models became feasible, the traffic modeling community settled into the “detail” concerns. TCP’s congestion control algorithm complicated the matter of modeling traffic, so solutions needed to be created. Parameter estimation of self-similar models was always difficult, and recent research addresses ways to model network traffic without fully understanding it.
This section covers these topics in order. First, we deal with the classical self-similar model, fractional Brownian motion (fBm). Next, we move to chaotic maps in an attempt to deal with the impact of TCP congestion control. Finally, we examine one of the newest systems, SWING, designed to analyze and imitate arbitrary network traffic without understanding the underlying distributions.
When self-similar traffic models were first introduced, there were no efficient, analytically tractable processes to generate the models. Ilkka Norros devised a stochastic process for a storage model with self-similar input and constant bit-rate output [Norros94]. While this initial model was continuous rather than discrete, the model was effective, simple, and attractive.
Before discussing Norros’ stochastic process, we first define the normalized fractional Brownian motion (fBm). A fBm is a continuous-time Gaussian process defined for all positive time values, with mean centered at 0, and autocorrelation defined on the Hurst Parameter (H) as:
Mathematically, Norros’ process is represented as follows:
where A(t) is the process:

and Z(t) is a normalized fBm with Hurst Parameter in (½,1]. The process parameters are m, the mean input rate; a, the variance coefficient; H, the Hurst Parameter; and C, the service rate.
Norros demonstrated analytical solutions to a number of previously difficult problems. He calculated analytical solutions to the resulting model for superpositions of fBm models and of time-scaled fBm models. He even calculated an analytical solution of the capacity planning problem, “how much space should be allocated to reach a given quality of service?” Finally, he validated this solution by re-verifying the old intuition that for connectionless traffic, enlarging buffers will not increase utilization significantly.
One topic not addressed is the difficulty of determining appropriate Hurst Parameters for a self-similar flow. This problem proves to be fairly difficult in practice, and significantly limits the application of Norros’ work.
The impact of network dynamics on self-similar traffic models is addressed in [Erramilli02]. The authors note that TCP congestion control seems to impact self-similar processes only in the small scale — a scale of RTTs at most. However, within that scale, the impact is severe.
To correct this, the authors propose a Chaotic Map model of TCP feedback. Chaotic maps can be thought of as a form of continuous-state Markov chains. A state variable, x, is defined by a function

where x is in [0,1] and d marks a state boundary. For purposes of modeling ON/OFF network traffic sources, the authors suggestion that when x is higher than d, the source is ON; when x is below d, the source is OFF.
To apply chaotic maps to TCP feedback mechanisms, we use a pair of chaotic maps, one for the window size and one for the ON/OFF state. We also assume that each iteration is one RTT (and thus every modeled TCP session has the same RTT). We also establish session length by the starting point in the ON state, and when in the ON state, the source sends the entire avilable TCP window. All other pieces proceed logically from here.
From these assumptions, a set of tightly coupled functions can be written describing the evolution of TCP windows and source ON/OFF states. This limited model does not handle retransmission of lost packets, nor the retransmit timeout. The authors speculate that these mechanisms will introduce additional correlations.
In simulation, the chaotic map technique successfully generates distributions that resemble real TCP distributions. However, the authors do not attempt to validate the results against real network traffic. Despite being a valuable contribution to the field, chaotic maps could use better validation, especially in a field where the historical problem has been a poor match between theory and reality.
All self-similar traffic models suffer from one significant drawback: estimating the self-similarity parameters from real network traffic requires huge amounts of data and takes extended computation. The method used in the original study from [Leland94] takes thousands of observations to converge, since they require analyses at aggregation levels up to 1000. The most modern method, wavelet multi-resolution analysis [Abry98], is more efficient, but still very costly.
This is clearly undesirable in a traffic model. In [Vishwanath06], the authors attempt to construct a system that captures packet interactions, extracts distributions for aspects of the traffic, and then generates realistic traffic with the same characteristics.
SWING uses a surprisingly simple model for the network traffic analysis and generation. The model examines characteristics of users, Request-Response Exchanges (RREs), connections, individual packets, and the overall network. No attempt is made to analyze self-similarity characteristics; any self-similarity in the generated traffic comes naturally from the aggregation of many ON/OFF sources.
SWING is validated against real traffic by extracting the Hurst Parameter from both the generated trace and the real traffic. Surprisingly, it performs very well even at sub-RTT timescales. The authors claim to be the first to produce burstiness across a wide range of time scales. They may well be right. One would still expect that, mathematically, the generated traffic will not exhibit self-similarity over extremely large time periods; however, this is a theoretical concern. From a practical standpoint, SWING works exceptionally well.
Having examined existing traffic models from the earliest to the latest, the question must be asked: what models are used in practice today? Are they still valid? Have theorists finally embraced self-similarity?
First, we look at the models in practical use today in simulation and in practice. Finally, we discuss the current validity of these models and provide advice to readers of traffic modeling literature.
NS-2 [NS2] is the most popular network simulator in use today; thus, state of the art in NS-2 should give a good indicator of the state of the art in use today.
PackMimeHTTP is a web traffic generator for NS-2, published in 2004 [Cao04]. It does take long-range dependencies into account, and uses the Weibull distribution. Thus, it relies on heavy tails to emulate true self-similarity. Over most time scales, the effort is a success; only an unusually long-running simulation would allow a distinction to be drawn. This follows suggestions from [Floyd01] where it is suggested that self-similar processes can be represented as a superposition of many sources each individually modeled with a heavy-tailed distribution.
This is just one traffic generator, but it is clear that self-similar traffic models are definitely in the mainstream.
However, in queuing literature, we find that Poisson models are still very popular due to the convenient analytical properties. This is unsurprising, considering how intractable self-similar models can be in analytical models. Simulations can afford to address such matters numerically and for finite lengths of time instead of seeking steady-state solutions.
We have reviewed a series of traffic models from the earliest inception to today’s most advanced models. Early models assumed that network traffic followed a memoryless model, and ignored the possibility of long-range dependency or self-similarity.
With proper data available for analysis, the models finally broke down. Clear, irrefutable evidence of self-similarity was discovered, and a new cluster of models were created. The impact of TCP on traffic models has been investigated and addressed. Finally, the hard problem of emulating arbitrary, realistic traffic has been partially addressed in the most modern model, SWING.
The outlook is generally promising. However, it should be remembered that queuing theory tends to overlook self-similar processes with long-range dependence because of practical difficulties. As of today, simulations should prove to be more accurate than analytical models, and preference should be given to simulation-based analysis over pure modeling. In all cases, validation against experimental measurements is still the only way to obtain high confidence. Even today’s sophisticated models are clearly still short of the full complexity of real Internet traffic.
[Marathe82] Marathe, M., and Hawe, W. “Predicted Capacity of Ethernet in a University Environment,” Proceedings of Southcon 1982, March 1982, pp 1-10.
[Jain86] Jain, R., Routhier, S.A. “Packet Trains - Measurements and a New Model for Computer Network Traffic,” IEEE Journal on Selected Areas in Communications, Vol. 4, No. 6, September 1986, pp. 986-995. http://www.cs.wustl.edu/~jain/papers/ftp/train.pdf
[Heffes86] H. Heffes and D. M. Lucantoni “A Markov Modulated Characterization of Packetized Voice and Data Traffic and Related Statistical Multiplexer Performance,” IEEE Journal on Selected Areas in Communications, Vol. 4, No. 6, September 1986, pp. 856-868. http://ieeexplore.ieee.org/document/1146393/
[Will00] Willinger, W. “The Discovery of Self-Similar Traffic,” In Performance Evaluation: Origins and Directions G. Haring, C. Lindemann, and M. Reiser, Eds. Lecture Notes In Computer Science, vol. 1769. Springer-Verlag, London, 513-527. http://portal.acm.org/citation.cfm?id=647347.724329
[Abry98] Abry, P., and Veitch, D. “Wavelet analysis of long-range-dependent traffic,” IEEE Transactions on Information Theory 44, 1 (1998), 215. http://citeseer.ist.psu.edu/abry98wavelet.html
[Mandelbrot65] B. Mandelbrot. “Self-similar error clusters in communication systems and the concept of conditional stationarity,” In IEEE Transactions on Communication Technology COM-13, pages 71--90, 1965. http://ieeexplore.ieee.org/document/1089090/
[Frost94] V. Frost and B. Melamed, “Traffic Modeling for Telecommunications Networks,” IEEE Communications Magazine, 32(3), pp. 70-80, March, 1994. http://ieeexplore.ieee.org/document/267444
[Leland94] Leland, W. E., Taqqu, M. S., Willinger, W., and Wilson, D. V. 1994. “On the self-similar nature of Ethernet traffic (extended version),” IEEE/ACM Trans. Netw. 2, 1 (Feb. 1994), 1-15. http://dx.doi.org/10.1109/90.282603
[Park99] K. Park and W. Willinger. “Self-similar network traffic: An overview,” In K. Park and W. Willinger, editors, Self-Similar Network Traffic and Performance Evaluation. Wiley Interscience, 1999. http://citeseer.ist.psu.edu/park99selfsimilar.html
[Paxson95] V. Paxson and S. Floyd, “Wide-area Traffic: The Failure of Poisson Modeling,” IEEE/ACM Transactions on Networking, pp.226-244, June 1995. http://citeseer.ist.psu.edu/paxson95widearea.html
[Erramilli02] Ashok Erramilli, Matthew Roughan, Darryl Veitch, Walter Willinger. 2002. “Self-Similar Traffic and Network Dynamics,” In Proc. of the IEEE., Vol 90, no. 5. http://citeseer.ist.psu.edu/700718.html
[Norros94] Ilkka Norros. “A storage model with self-similar input,” Queueing Systems, 16:387--396, 1994. http://citeseer.ist.psu.edu/norros94storage.html
[Vishwanath06] Vishwanath, K. V. and Vahdat, A. 2006. “Realistic and responsive network traffic generation,” In Proceedings of the 2006 Conference on Applications, Technologies, Architectures, and Protocols For Computer Communications (Pisa, Italy, September 11 - 15, 2006). SIGCOMM '06. ACM Press, New York, NY, 111-122. http://doi.acm.org/10.1145/1159913.1159928
[NS2] http://www.isi.edu/nsnam/ns/
[Cao04] J. Cao, W.S. Cleveland, Y. Gao, K. Jeffay, F.D. Smith, and M.C. Weigle, “Stochastic Models for Generating Synthetic HTTP Source Traffic,” Proc. IEEE INFOCOM, Hong Kong, Mar. 2004, pp. 1547-1558. http://citeseer.ist.psu.edu/cao04stochastic.html
[Floyd01] Floyd, S., Paxson, V. “Difficulties in simulating the internet,” In IEEE/ACM Transactions on Networking (2001). http://citeseer.ist.psu.edu/floyd01difficulties.html
These references are present for background information that, while
well-established in the field, may not be universally understood by the
reader. The references cited are selected for educational value rather
than authoritativeness.
*Note on Figure 1: While author permission
for this figure has been obtained, the copyright may belong to the IEEE.
Permission from IEEE to re-use is still pending.
7. Informational References
8. List of Acronyms Used
This report is available on-line at
http://www.cse.wustl.edu/~jain/cse567-06/traffic_models2.htm
List of other reports in this series
Back to Raj Jain's home page