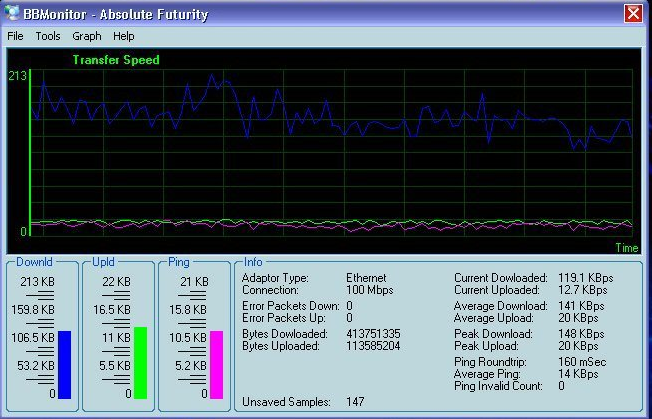
Figure 3-1: Screen shot of BBMonitor
Various network performance monitoring tools have been developed and implemented over the last few years. These tools allow us to test different aspects of network performance and they are developed by individuals, commercial companies, non profit organizations, and government organizations. Some of them are free, open source, while some of them are not.
Various network performance monitoring tools have been developed and implemented over the last few years. These tools allow us to test different aspects of network performance and they are developed by individuals, commercial companies, non profit organizations, and government organizations. Some of them are free, open source, while some of them are not.
The rest of the paper is organized as follows. Section 2 lists Monitoring tools developed from 1996 to 2006, from most recent to old tools. Section 3 briefly discusses some selected popular tools. Section 4 concludes the report.
| Year | Name of Tools |
| 1996 | mrtg, NetNow, NetraMet, Network Probe Daemon, InterMapper, Lachesis, Optimal Networks, Digex |
| 1997 | INS Net Perf Mgmt survey, tcpspray, Mapnet, Keynote, prtraceroute clflowd flstats, fping, tcpdpriv, NetMedic Pathchar, CAIDA Measurement Tool Taxonomy, bprobe and cprobe |
| 1998 | NetOps, Triticom, Maple, PV-Wave, S-Plus, VisualRoute. |
| 1999 | Cheops, Ganymede, hping2, Iperf, JetMon, MeasureNet, MatLab, MTR, NeoTrace, Netflow, NetLogger, Network health, NextPoint, Nmap, Pchar, Qcheck, SAA, SafeTP, Sniffit, SNMP from UCSD, Sting, ResponseNetworks, Tcpshow, Tcptrace WinTDS. |
| 2000 | Analyzer, bbftp, Big Brother, Bronc, Cricket, EdgeScape, Ethereal (now renamed Wireshark), gen_send/gen_recv, GSIFTP, Gtrace, Holistix, InMon, NcFTP, Natas, NetAlly, NetScout, Network Simulator, Ntop, PingGraph, PingPlotter, Pipechar, RRD, Sniffer, Snoop, StatScope, Synack, View2000, VisualPulse, WinPcap, WU-FTPD, WWW performance monitoring, Xplot. |
| 2001 | AdventNet SNMP API, Alchemy Network Monitor, Anasil analyzer, Argent, Autobuf, Bing, Clink, DSLReports, Firehose, GeoBoy, PacketBoy, Internet Control Portal, Internet Periscope, ISDNwatch, Metrica/NPR, Mon, NetPredict, NetTest, Nettimer, Net-One-1, Pathrate, RouteView, sFlow, Shunra, Third Watch, Traceping, Trellian, HighTower, WCAT, What��s Up Gold, WS_FTP, Zinger. |
| 2002 | ANL Web100 Network Configuration Tester, Anritsu, aslookup, AlertCenter, Alertra, AlertSite, Analyse-it, bbcp, BestFit, Bro, Chariot, CommView, Crypto-Pan, elkMonitor, DotCom, Easy Service Monitor, Etherpeek, Fidelia, Finisar, Fpinger, GDChart, HipLinkXS, ipMonitor, LANExplorer, LinkFerret, LogisoftAR, MGEN, Netarx, NetCrunch, NetDetector, NetGeo, NEPM, NetReality, NIST Net, NLANR AAD, NMIS, OpenNMS PageREnterprise, PastMon, Pathprobe, remstats, RIPmon, RFT, ROMmon, RUDE, Silverback, SmokePing, Snuffle, SysOrb, Telchemy, TCPTune, TCPurify, UDPmon, WebAttack, Zabbix. |
| 2003 | AbwE, ActivXpets, AdventNet Web NMS, Analyse It, Argus, Big Sister, CyberGauge, eGInnovations, Internet Detective, Intellipool Network Monitor, JFF Network Management System, LANsurveyor, LANWatch, LoriotPro, MonitorIT, Nagios, NetIntercept, NetMon, NetStatus, Network Diagnostic Tool, Network Performance Advisor, NimBUS, NPS, Network Probe, NetworksA-OK, Sniff��em, Spong, NetStat Live, Open NerveCenter, OPENXTRA, Packeteer, PacketStorm, Packetyzer, PathChirp, Integrien, StableNet PME, TBIT, Tcptraceroute, Tping, Trafd, Trafshow, TrapBlaster, Traceroute-nanog, Ultra Network Sniffer, Vivere Networks. |
| 2004 | MonitorMagic, N-central, N-vision, Netmeter, CleverEye, CueVision, D-ITG, Network Physics, FastCopy, internetVista, IPCheck Server, OSSMon, H.323 Beacon,Monitor,FREEping,NetMechnica, NetVizor, Observer, Overseer, ZTI Network Monitor, Orca, PRTG Traffic Grapher, QOVIA, Qradar, Wombat, Route Explorer, Scriptroute, Server Nanny, SNMP Explorer, Ganglia, GFI Network Services Monitor, Little:eye, STAB a Linux tracepath, SolarWinds Orion, Vantage, Vigilix, VitalNet, WatchTower Website Monitoring, WindowsNetworking.com, ServerFiles.com, SNMP Informant, |
| 2005 | bulk, BWCTL, Caligare Flow Inspector, Cittio, ClearSight, Distinct Network Monitor, EM7, EZMgt, GigaMon, Host Grapher II, HPN-SSH, Javvin Packet Netcool, netdisco, Netflow Monitor, NetQoS, Pathneck, OWAMP, RANCID, SiteMonitor, STC, SwitchMonitor, SysUpTime, TansuTCP, thrulay, Torrus, Tstat, VSS Monitoring, WebWatchBot, WildPackets, ZoneRanger, Advanced HostMonitor, Just-ping, LinkRank, MoSSHe, mturoute, N-able OnDemand, Scamper, SCAMPI, Simple Infrastructure Capacity Monitor, Spirent, Alvias, Airwave, AppMonitor, BitTorrent, PingER, Analyzer, |
| 2006 | Cacti, CSchmidt collection, Cymphonix Network Composer, Darkstat, Ey-on Bandwidth, SNM,Etherape, EZ-NOC, IPTraf, Jnettop, Zenoss, Gigamon Uni- versity, LITHIUM, mrtg-ping-probe, NetMRG, NetworkActiv Scanner, Web Server Stress Tool, NimTech, NPAD, Nsauditor, Nuttcp, OpenSMART, Plab, WatchMouse, Pandora FMS, PIAFCTM, PolyMon, PSentry, Rider, Sysmon, SpiceWorks,SftpDrive, SpeedTest, TruePath, Unbrowse, Unsniff, Webalizer, RSP, Pktstat |
| Name | Type | Performance Metrics | OS | Test Mode | GUI | License |
| BBMonitor | Application Monitoring | Bandwidth usage and speed | Windows | Active | Yes | Commercial |
| Advanced Monitoring | Application Monitoring | Network traffic and sever's availibility | Window | Active | Yes | Commercial |
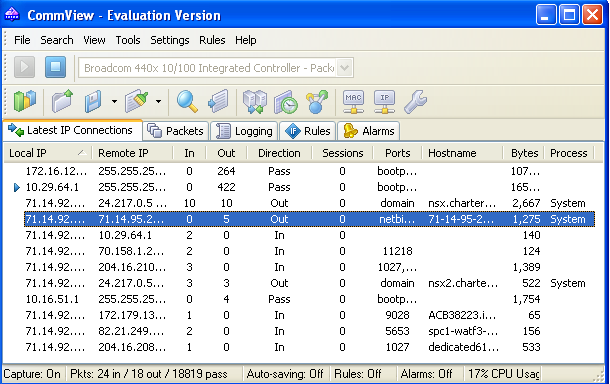
| CommView | Analyzer | Internet and LAN activity | Windows | Active | Yes | Commercial |
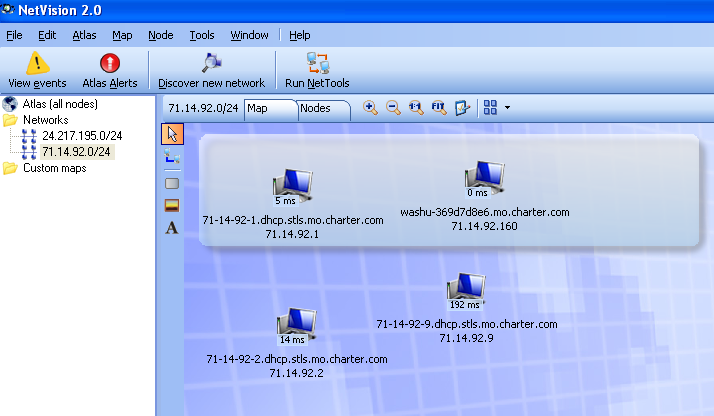
| Axence NetVision | Application monitoring | applications, TCP/IP services and SNMP devices | All major OS | Active | Yes | Commercial |
| Pchar | Path Characterization | Bandwidth, throughput, latency, packet loss | Unix/Linux | Active and passive, UDP, ICMP | No | free |
| Chariot | Application | Throughput, jitter, delay, packet loss | Windows | Active TCP/UDP | Yes | Commercial |
| Traceping | One-way availability/ latency tests | Packet loss | VAX/ VMS | Active, ICMP | No | Free |
| SYNACK | Path characterization | Latency | Solaris, Linux | Active, TCP | No | Free |
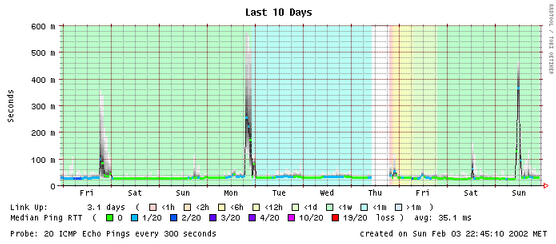
| SmokePing | Path characterization | Latency, packet loss | Unix | Active, ICMP | Yes | Free |
| PathChar | Path characterization | Bandwidth, throughput, latency, packet loss | FreeBSD, Solaris, Linux | Active, Passive, UDP | Yes | Free |
| MGEN | Traffic generator | Packet loss, delay, jitter | Linux/Unix | Active, UDP | Yes | Free |
| Gtrace | Forward path probe | Node name,IP location, latency | Solaris/Linux/ FreeBSD | Active, UDP, ICMP | Yes | Free |
| MTR | Patch characterization | Packet loss, delay, jitter | Linux/Unix | Active, ICMP | Yes | Free |
| Gen_send, gen_recv | Traffic generator | Bandwidth, packet loss | Linux/Unix | Active | No | Free |
| BBFTP | FTP | TCP goodput | Linux/Unix | Active | No | Free |
| Argus | Flow monitoring | Track and report network transaction | Unix | Active | Yes | Free |
GFI Network Server Monitor can check the status of a terminal server by actually performing a complete login and checking if the session is established correctly. GFI Network Server Monitor can check the availability of all leading database applications. GFI Network Server Monitor includes extensive checks for monitoring Linux servers. All CPU usage, printer availability, file existence, process running, folder size, file size, users and groups membership, disk partition check and disk space can be monitored by GFI Network Serve.
GFI Network Server Monitor allows you to store monitoring data to either an SQL Server or MS Access database backend. SQL Server is more appropriate for users with higher monitoring level requirements as well as those who need to centralize the monitoring results of multiple GFI Network Server Monitor installations in one place, such as backups, remote accessing as well as report generation by third party tools such as Crystal Reports or MS Reporting Services.
You can check rule status from any location using GFI Network Server Monitor's remote web monitor. You can check critical processes and services on local and remote computers using GFI Network Server Monitor. You can also monitor the CPU usage of a machine.
Argus can analyze and report on the contents of packet capture files and it can run as a continuous monitor, examining data from a live interface, generating an audit log of all the network activity seen in the packet stream, providing both push pull data handling models and allowing flexible strategies for collecting network audit data. Argus can be used to monitor individual end-systems, or an entire enterprises network activity. Argus data clients support a range of operations, such as sorting, aggregation, archival and reporting. The network transaction audit data that Argus generates has been used for a wide range of tasks including Security Management, Network Billing and Accounting, Network Operations Management and Performance Analysis.
| SQL | Structure Query Language |
| AS | Autonomous System |
| LAN | Local Area Network |
| WAN | Wide Area Network |
| DNS | Domain Name System |
| TCP/IP | Transmission Control Protocol / Internet Protocol |
| UDP | User Datagram Protocol |
| OS | Operating System |
| FTP | File Transfer Protocol |