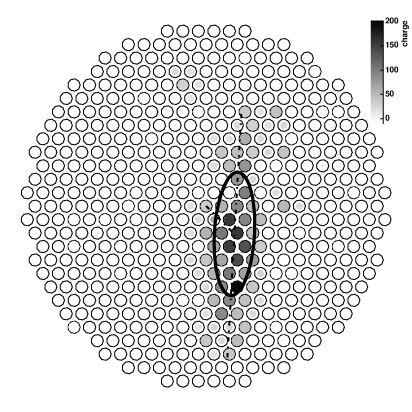
Figure 1: VERITAS sensor array with sample event superimposed
This section introduces the X language, a data-flow language designed to ease the development of high-performance applications deployed on parallel and/or heterogeneous architectures. The application under study, a high-energy astrophysics algorithm employing both digital signal processing and image processing, is also introduced herein.
High-performance algorithms can be roughly categorized as being dominated by either data-flow or control-flow. Scientific, multimedia, signal-processing, and networking algorithms in particular are often dominated by data-flow; their performance is contingent primarily on the flow of large "streams" of data through a discrete set of processing tasks.
Data-flow dominated applications share a number of convenient properties when being implemented[Niemann98]. The flow of data itself often yields a good degree of parallelism, both trivial parallelism (e.g. the individual elements of vector addition can be summed at the same time) and pipeline or task-level parallelism (e.g. operations can be performed assembly-line style by individual compute elements). Trivial parallelism yields excellent scaling on SIMD-capable machines at a fine granularity (e.g. vector elements), or clusters of machines at a coarser granularity (e.g. pixel regions in an image). Pipeline parallelism can lead to good scaling in inherently parallel machines (e.g. application-specific ICs (ASICs) and FPGAs, network processors), as well as heterogeneous combinations of resources (e.g. systems including both FPGAs and traditional processors).
Extracting good performance and resource scaling from these systems can be difficult for a variety of reasons [Johnston04]. In scientific applications, the user-authors themselves are not well-versed in parallel algorithm development (at least not in pipeline parallelism or more complex data flows), and they are rarely skilled in the development on uncommon platforms such as digital signal processors (DSPs) or FPGAs.
To help such users, a data flow language called X [Tyson05] was developed concurrently with a compiler and set of analysis tools called the Auto-Pipe toolset [Tyson06]. In X, applications are developed in a data-flow centric manner, where the application is described as a set of high-level tasks (e.g. Fourier transforms, vector math, complex merge operations). It is significant that X does not deal with the actual implementation of the blocks; this is left for traditional languages such as C, VHDL, or assembly (depending on the target platform). In this way, X is capable of extracting and improving the coarse-grained parallelism of a system, while leaving the actual task implementations (and the corresponding fine-grained parallelism) to other languages. This is seen as a strength, rather than a weakness, because it encourages fine-grained performance optimization at a task level using well-understood languages, and encourages the development of a core library of optimized task implementations.
While one main advantage of using X is development on heterogeneous computing architectures, only software architectures are examined in this paper. This does, however, still demonstrate its other strength: the ability to easily explore partitioning of an application onto computation resources.
The application examined in this paper performs a process called the imaging atmospheric Cherenkov technique. This is a method of detecting and characterizing the high energy gamma-rays that strike the Earths atmosphere. This section describes this application and its implementation in the X language.
Numerous scientifically interesting gamma-ray sources exist in the vicinity of the Earth, constantly or intermittently showering the planet with energetic gamma-rays and high-velocity cosmic particles. Among these sources are pulsars, supernovae, neutron star collisions, and supermassive black holes.
Due to physical constraints and sensor technology, it is infeasible to directly detect gamma-rays. Instead, ground-based detectors rely on a byproduct of the gamma-rays' transit through the atmosphere [Kosack05]. As gamma-rays interact with atmospheric particles, they undergo a variety of transformations, ultimately emitting numerous faint rays of blue light called Cherenkov radiation. These showers of light strike the ground in specific patterns that indicate characteristics of the originating cosmic particle, such as origin, type, and energy. This light is then directly detectable using very sensitive light-measuring devices called photomultiplier tubes. An example of the accumulated charge on each tube after a gamma-ray event is shown in Figure 1.
Figure 1: VERITAS sensor array with sample event superimposed
In a specific gamma-ray observation experiment called VERITAS [Weekes02], for which the implementation presented in this paper has been specifically written, the gamma-ray detecting apparatus consists of four 12 meter dishes, each reflecting Cherenkov light onto an array of 499 photomultplier tube sensors. Each telescope is processed individually, and a later stage of processing will collate the event data to fully parameterize the event. Each sensor detects photons at rates in excess of 500MHz using fast "flash" analog-to-digital converters to convert the analog pulse transduced from the light into digital counts.
Finding the analog waveforms at each channel is just the preliminary stage to a complex digital signal processing pipeline. Atmospheric effects and light pollution (from starlight as well as human sources) contributes a significant amount of baseline noise to the measurement of Cherenkov photons. Additionally, imperfections in the analog circuitry and sensing technique cause a convolution that "smears" the ideal charges into asymmetric pulses. To correct for these effects, the signal must be deconvolved to produce a cleaner pulse, and the noise must be removed without destroying too much of the Cherenkov pulse.
The implementation of a VERITAS gamma-ray event parameterization application is presented in loose data-flow form in Figure 2. Here, the deconvolution is performed in the frequency domain, with Fourier transform operations FFT and inverse FFT used to convert to and from the frequency domain, respectively. In the frequency domain, a lowpass operation is also performed that, in conjunction with a padding of the data, increases the resolution of the waveform with interpolation. Once converted back to the time domain, the signal is summed to a single charge for that channel and compared to a threshold to determine whether the individual channel is significant enough to include in the image analysis. The passing charges are then used to compute a set of moments (the first and second X and Y moments, and their co-moment) in the field of the array for that event. These moments are used to find the best fit of the event to a model of a typical cosmic particle event, a filled or hollow ellipse at a particular orientation.
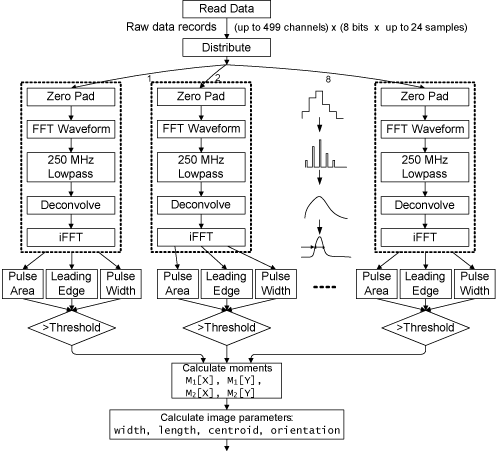
Figure 2: The VERITAS pipeline for Cherenkov image parametrization
For this paper, the data flow exposes eight individual pipelines to perform the computationally complex per-channel processing, as indicated in Figure 2. Every unprocessed event arrives as a set of 499 digitized waveforms, which are evenly distributed among the eight pipelines. The effect of this choice on scaling and overall performance will be seen and discussed in Section 3.
Back to the Table of ContentsThis section describes the processes and techniques used in performing the case study found in this paper. The performance gathering techniques are discussed in Section 2.1, and the statistical techniques used to analyze the raw data are discussed in Section 2.2. Section 2.3 briefly examines some unideal circumstances and measurement error that should be understood when performing such analysis on a real-world system.
It is important when designing a high-performance application to understand the performance-critical components of the algorithms used. Analytic models are generally understood to be infeasible due to the complexity of modern processors and memory systems. Therefore, support from the execution environment in the form of profiling can be very valuable when improving the performance of such an application.
The compiler for the X language, X-Com, intrinsically supports the profiling of any application components deployed onto software platforms (i.e. GPPs). For every task and inter-computer communication link, the aggregate processing time and number of calls to that task are recorded. From this information, the mean processing time of each task can be computed. These statistics are kept for every instance of each task, not just each type of task. This allows for more relevant timing information to be kept, such as data-dependent performance effects, than would be determined with a traditional profiling tool (e.g. gprof). The actual timing values are found using the x86 RDTSC instruction, and is thus cycle-accurate (with some caveats discussed in Section 2.3). Measurements are made:
Datum-to-datum profiling, such as individual inter-arrival and task service times, can also be measured. This is done through the use of a federated simulation environment called X-Sim [Gayen06]. X-Sim replaces inter-task connections with file accesses, and translates between simulation time and the native execution times of the federated simulators. While even more detailed information can be gleaned using such a tool, this paper will only examine the performance data found using the basic profiling tools in plain, native execution.
Section 3 will present a summary of the execution times found using the profiling mechanisms described in Section 2.1, and the setup described in Section 3.1. A variety of statistical techniques are used to turn these numbers into more a meaningful quantitative expression of the relative importance and significance of the effects. These techniques are summarized below, and are discussed further in sources such as [Jain91].
In addition to the basic statistics of mean and standard deviation (st. dev.), confidence intervals are an expression of the range of values within which the statistics offer a certain degree of certainty that the "true" value will lie. For instance, a 90% confidence interval (1.5,2.5) means that it is 90% likely that the ideal value that was measured with a mean of 2 will in reality be between 1.5 and 2.5.
Another important analysis technique is the decomposition of performance into relative effects of the factors under experimentation. In a 22 factorial analysis, for instance, there are two factors under consideration, each of which has two potential values. Assuming a linear model for the combination of effects from the two factors, the actual individual values of the effects can be determined, as well as the value of their interaction, the effect of changing both factors at once. This analysis can be further improved by making multiple measurements of the performance, and using the resulting analysis of variation to provide a confidence interval for the effects.
Some issues arise when measuring the performance of real-world systems as will be done in the following section. The effects of multitasking present one such issue, where many kernel-space and user-space programs can take processing time away from the program being measured. This manifests itself when an initial clock time is read by the profiler, but another program is scheduled before the final clock time is recorded. The time spent running the intervening program is then measured as part of the measured block execution time. This effect has been estimated based on previous work to produce no worse than 0.5% error in the data, and likely much less [Tyson06].
As with any software-only runtime profiling system, there is an overhead associated with recording the performance of the application. The mechanism that monitors performance in X inserts two profiling operations per block, plus two profiling operations per tranmission of data. Each profiling operation includes only a small number of instructions, one of which is a memory access to the block's data structure (which is very likely cached), for which there are no dependencies. For the purposes of this paper, it shall be assumed that this has a negligible effect on performance.
Back to the Table of ContentsThis case study compares four different deployments of the same application onto a machine containing four processor cores. The application performs the VERITAS event parameterization procedure, as described in Section 1. It is implemented using the X language, with tasks implemented in C and C++ and reasonable attention given to the performance of each task.
Section 3.1 introduces the factors over which the experiments are run. The following sections present the resulting performance from both a high-level and a low-level view of the application.
Figure 3 depicts the two deployment schemes or mappings of the application onto hardware resources. Dashed and dotted boxes contain a subset of the application and a number indicating to which processor that subset is allocated. The first mapping, hereafter "2P," divides the tasks onto processors. It places the reading tasks and half of the signal processing pipelines on the first, and the remaining signal processing pipelines and the image processing tasks on the second processor. The second mapping, "4P," further partitions the application by adding two processors, which each take a portion of the signal processing pipelines from the previous two processors.
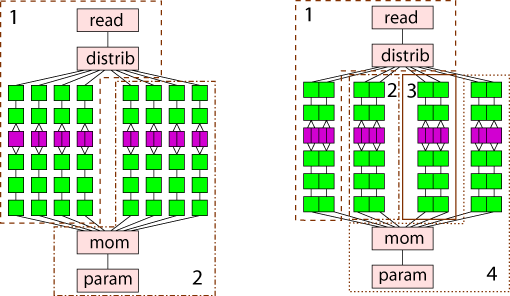
Figure 3: Two parallel mappings of the VERITAS application
The second factor which this case study will examine is the type of interconnect used to send data between the processors. Two options are explored: TCP [RFC793] using the standard Unix sockets API, and inter-process communications (IPC) using System V message queues [ATT89]. TCP's advantages are its near-ubiquity, diverse platform support, and abstraction from low-level details (e.g. physical medium). IPC, in contrast, has lower per-message and per-connection overhead by drastically reducing the number of memory operations necessary, and entirely removing the complex routing and flow control support. Contrasting these two methods will hopefully yield a meaningful quantitative comparison that may provide insight when designing other applications in X with similar communication requirements.
The performance data in this section were found by executing the X-Com generated programs on a single machine. This machine contains 8GB of memory distributed to two AMD Opteron 270 processors, which are dual-core devices and thus total four cores, operating at approximately 2000 MHz, with 1MB of L2 cache per core. The machine was running Red Hat Enterprise Linux AS 4, with Linux kernel 2.6.9-34 for x86-64 architecture. The processor mapping was maintained by using the sched_setaffinity Linux system call to restrict the scheduling of each program to only one of the four logical processors.
Each program instance was executed on the same dataset, a 240MB, 20,000-event long subset representing about 3 real-time minutes of 30-minute scan of a galactic source. Repetitions of the same mapping and communication parameters were run back-to-back with less than two minutes between runs in each case.
All combinations of mapping and communication method were evaluated four times each. The wall-time results of these sixteen executions are presented in Table 1. By repeating the execution, the variation over time and run-to-run can be seen. Each mapping's maximum runtime occurs in the first execution, consistent with a small but noticible effect of disk caching on the first run of a series. The variance was relatively small; at 99% confidence, it is certain that in all cases, going from the 2P to 4P mapping, or from TCP to IPC, represents a performance improvement. Whether the 4P/TCP implementation is better than the 2P/IPC implementation is somewhat less certain, at 89% certainty.
| Mapping | Comm. | Execution times (s) | Mean | St. Dev. | |||
|---|---|---|---|---|---|---|---|
| 2P | IPC | 216 | 213 | 215 | 213 | 214.3 | 1.6 |
| 4P | IPC | 137 | 135 | 136 | 137 | 136.3 | 1.0 |
| 2P | TCP | 266 | 259 | 263 | 259 | 261.8 | 3.2 |
| 4P | TCP | 207 | 190 | 190 | 190 | 194.4 | 8.7 |
Table 1: "Wall clock" execution time data
From the data in Table 1 we can determine the effects of the mapping and communication factors using basic two factor analysis. These effects are summarized in Table 2. The analysis tells us that moving from TCP to IPC alone has an effect of reducing the execution time by 49.5 to 56.0 seconds (twice the effect; 35 to 38 percent), and moving from mapping 2P to mapping 4P decreases execution time by 69.5 to 75.9 seconds (25 to 28 percent).
| Effect | Mean (s) | 90% Interval (s) | % Variation |
|---|---|---|---|
| Mean | 201.7 | (200.1,203.3) | 100 |
| Mapping +2P/-4P | 36.4 | (34.8,38.0) | 64.8 |
| Comm. +TCP/-IPC | 26.4 | (24.8,28.0) | 34.1 |
| Interaction TCP+2P | 2.67 | (2.13,8.54) | 0.3 |
| Error | 4.09 | 0.8 |
Table 2: Summary of the two factorial analysis of total execution time
Table 3 further examines the performance of the gamma-ray application by isolating the FFT and IFFT tasks, the single most computationally demanding portion of the computation. The times shown are the aggregate times, found by summing the time spent by FFT and IFFT in each of the two or four processes. The confidence intervals are relatively small, with deviations from the mean of at most 0.3% of the total.
| Mapping | Comm. | 90% Interval (s) |
|---|---|---|
| 2P | IPC | (163.2,163.8) |
| 4P | IPC | (162.0,162.6) |
| 2P | TCP | (164.1,164.8) |
| 4P | TCP | (165.1,166.3) |
Table 3: Aggregate execution time of the FFT/IFFT tasks
Table 4 also isolates one task from each execution, this time examining the execution time of the file read task. Three of the 90% confidence intervals overlap each other, while the fourth, which uses TCP to communicate in the 4P mapping, takes roughly 10% more time.
| Mapping | Comm. | 90% Interval (s) |
|---|---|---|
| 2P | IPC | (6.50,6.66) |
| 4P | IPC | (6.68,6.75) |
| 2P | TCP | (6.61,6.71) |
| 4P | TCP | (7.21,7.45) |
Table 4: Aggregate execution time of the Read task
Back to the Table of ContentsThis section will review the results found in the previous section. The implications for the design of the VERITAS application, and data-flow dominated applications with similar communications characteristics are also discussed.
In Section 3.2, the overall execution time was presented as a function of two factors: the mapping and the communication technique. It was discovered that there was a statistically significant partial ordering of these four factors:
Therefore, for the VERITAS gamma-ray event parameterization application under similar hardware configurations, it can be presumed that IPC is a better communication technique than TCP, and the 4P mapping is a superior mapping to the 2P mapping. These results also provide a good starting point when considering the development of other applications. That is, IPC is probably a good method to start with for communication within a system. Further, architectures similar to 4P (i.e., using all four cores in a feed-forward manner) may be a good design for similar dataflow organizations.
It is also important to note that, as found in Table 2, the interaction between the communication technique and the mapping, while nonzero, does not have a strong effect on the performance of the application. Thus, when considering repartitionings similar to moving from 2P to 4P, a developer might not need to worry as much about evaluating all possible combinations of mapping and communication type, if development time is limited. Instead, the developer may be able to independently consider the mapping and communication type employed.
In Section 3.3, comparisons were made between the performance of two selected types of task on each of the mapping/communication combinations. While not exhaustive, these demonstrate the types of analyses that one can perform on the execution profiles generated by X applications.
Looking at Table 3 and the performance of the Fourier transform tasks, one sees both mapping and communication method affect the tasks' performance in a noticeable but relatively small way. At 90% confidence, the total execution times were all different, however the largest mean difference between configurations only affected the total time by 2%. This result has two useful implications; first, the small difference means that the developer may not need to worry very much about the effect that their specific configuration has on the runtime of mathematically complex operations like Fourier transforms. The second, and almost opposite finding, is that there is in fact a difference in performance, so developers do indeed need to be aware that there may exist blocks that are more affected by mapping and communication type.
The latter finding is exemplified by the performance of the Read task as given in Table 4. In this case, there was a noticeable effect in the case of this task which depends more on memory and disk access times, rather than complex calculation over a more local data set. It is very interesting to note that this effect of around 10-15% was seen most strongly in only one of the configurations, the 4P mapping with TCP communication. This is important because it means that in the case of similar tasks, developers not only need to be concerned about the effects of individual configuration factors on task performance, but they may also need to consider the interaction of these factors.
The finding that interactions of configuration factors have a significant effect on task performance conflicts slightly with the hypothesis in Section 4.1 that developers may be able to ignore interactions. This provides a good demonstration of the complexity that readily results from the subjective interpretation of statistically sound performance analyses. In the case of the current application, the solution is to remember the observation that the small effect of interaction is contingent upon the particular tasks found in the VERITAS application. Developers who employ tasks significantly different from those in this application, or who significantly change the proportions of the tasks, will need to take care in initially verifying any assumptions on the effects of configuration parameters before treating them as independent factors.
Back to the Table of ContentsThis paper presented an instance of a gamma-ray event parameterization application for the VERITAS high-energy astrophysics experiment. The application was implemented using the X dataflow language and compiler, which together provide support for the profiling of the dataflow through the system. A selection of statistical performance analyses were performed on multiple repetitions of a 22 factorial experiment. From this selection, important implications were discussed that developers of such an application would need to consider when attempting to attain the best performance.
It is important to note that while the configuration parameters presented in this paper were limited to two choices over two factors, and thus required a simple 22 factorial analysis, real-world deployments are not nearly as simple. A true development cycle would likely consider all reasonable processor-to-processor communication methods available (there are currently four such methods supported), as well as much broader selection of mappings. For instance, the utilization of each processor should be fine-tuned by balancing the partitioning so that each processor takes roughly the same amount of time to perform its tasks (eliminating bottlenecks).
Trivial dataflow parallelization was the primary technique used by the mappings in this paper. A more thorough exploration of the design space would also consider pipelined parallelism, such as placing all FFT tasks on one processor, all IFFT tasks on another processor, and so on. This increases the locality of each operation, and opens the possibility for heterogeneous processing architectures, but at the cost of an increased reliance on the communication structure and pipeline balancing.
Back to the Table of Contents| Acronym | Definition |
|---|---|
| ASIC | Application-Specific Integrated Circuit |
| DSP | Digital Signal Processor |
| FPGA | Field-Programmable Gate Array (reconfigurable hardware) |
| FFT | Fast Fourier Transform (convert to/from frequency domain) |
| GPP | General-Purpose Processor (e.g. Intel x86, IBM Power series) |
| SIMD | Single Instruction, Multiple Data (e.g. MMX or AltiVec instruction sets) |
| VERITAS | The Very Energetic Radiation Imaging Telescope Array System ("the application") |