Difference between revisions of "Analysis of Brain Signal Generation for EEG"
| Line 123: | Line 123: | ||
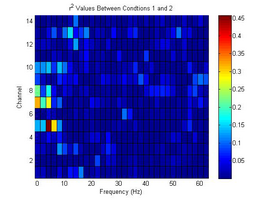
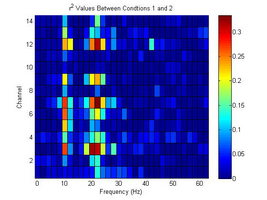
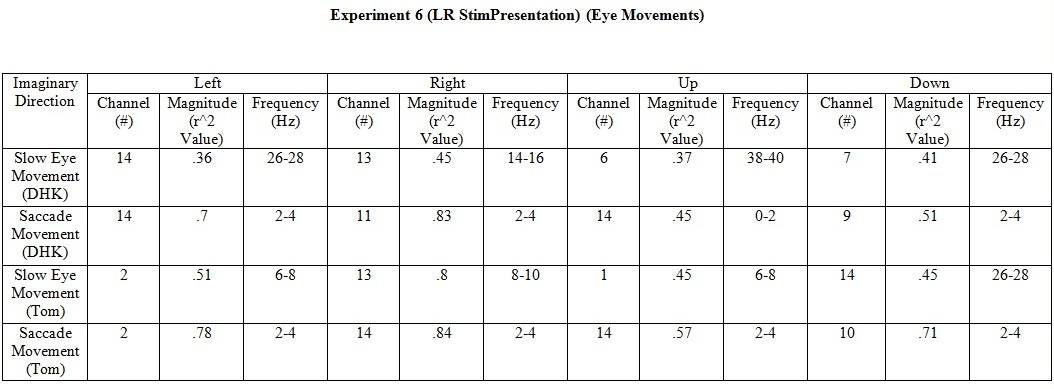
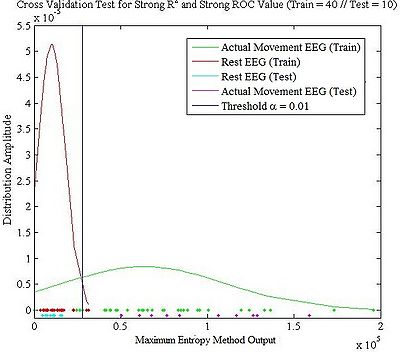
Since we have three statistical tests that can be used for analysis of BCI EEG signal data, we used cross validation to determine which test is suitable for analyzing EEG signal data. From the offline analysis, we found that the shape of <math> R^2 </math> test and F test result are always same—the only difference is the magnitude of output that <math> R^2 </math> is normalized and bound by 0 to 1. Therefore, for the Cross Validation, four specific channels and frequencies are chosen: strong <math> R^2 </math> and strong ROC, strong <math> R^2 </math> and weak ROC, weak <math> R^2 </math> and strong ROC, and weak <math> R^2 </math> and weak ROC. Population of training was 41 trials while the population of test was 10 trials. The Cross Validation is calculated from individual MEM (Maximum Entropy Method) outputs of individual stimuli EEG signals. | Since we have three statistical tests that can be used for analysis of BCI EEG signal data, we used cross validation to determine which test is suitable for analyzing EEG signal data. From the offline analysis, we found that the shape of <math> R^2 </math> test and F test result are always same—the only difference is the magnitude of output that <math> R^2 </math> is normalized and bound by 0 to 1. Therefore, for the Cross Validation, four specific channels and frequencies are chosen: strong <math> R^2 </math> and strong ROC, strong <math> R^2 </math> and weak ROC, weak <math> R^2 </math> and strong ROC, and weak <math> R^2 </math> and weak ROC. Population of training was 41 trials while the population of test was 10 trials. The Cross Validation is calculated from individual MEM (Maximum Entropy Method) outputs of individual stimuli EEG signals. | ||
| − | + | <gallery widths=400 heights=400> | |
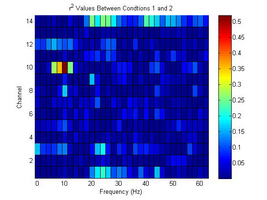
| + | File:BothStrong.jpg|Strong <math> R^2 </math> and Strong ROC | ||
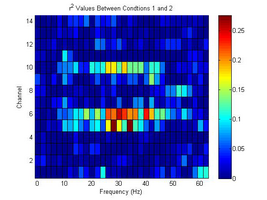
| + | File:OkayR^2_&_0_ROC.jpg|Strong <math> R^2 </math> and Weak ROC | ||
| + | </gallery> | ||
| + | <gallery> | ||
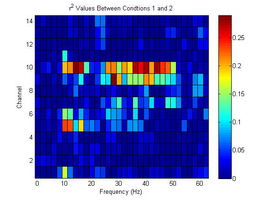
| + | File:Strong_ROC.jpg|Weak <math> R^2 </math> and Strong ROC | ||
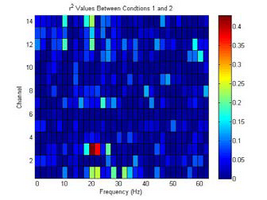
| + | File:BothWeak.jpg|Weak <math> R^2 </math> and Weak ROC | ||
| + | </gallery> | ||
As shown in Figure above, "strong <math> R^2 </math> and strong ROC" and ‘weak <math> R^2 </math> and strong ROC’ shows good results for the cross validation test. However, as we are looking for the signal that has distinguishable MEM outputs with a minimal variation, we conclude that one has to use signals from certain channels and frequencies that have strong <math> R^2 </math> and strong ROC values. | As shown in Figure above, "strong <math> R^2 </math> and strong ROC" and ‘weak <math> R^2 </math> and strong ROC’ shows good results for the cross validation test. However, as we are looking for the signal that has distinguishable MEM outputs with a minimal variation, we conclude that one has to use signals from certain channels and frequencies that have strong <math> R^2 </math> and strong ROC values. | ||
Revision as of 02:28, 21 February 2012
Contents
- 1 Abstract
- 2 Goals
- 3 Equipment and Program
- 4 Experimental Design and Hypotheses
- 4.1 Experiment 1 (Cursor Task)
- 4.2 Experiment 2 (LR StimPresentation)
- 4.3 Experiment 3 (Constant Action vs. Repetitive Action)
- 4.4 Experiment 4 (Few Large Muscles vs. Many Small Muscles)
- 4.5 Experiment 5 (Imaginary Action vs. Actual Action)
- 4.6 Experiment 6 (Eye Movements)
- 4.7 Experiment 7 (Trained Muscle Movement vs. Untrained Muscle Movement)
- 4.8 Experiment 8 (Directional Movements)
- 5 Analysis
- 6 Future
- 7 References
Abstract
- The overall goal of the WUSTL-BCI project is to have a brain-controlled interface (BCI) by means of a non-invasive electroencephalogram (EEG). The interface would then be used to control a hand exoskeleton for aiding in the rehabilitation of hand motor skills in people who suffer from severe motor impairment. However, the scope of BCIs is not limited to controlling the hand exoskeleton. It can be applied to just about any system that a person could otherwise control—personal computers, cars, and cell phones, just to scratch the surface. The purpose of this sub-project is to determine reliable methods of generating clear, consistent brain signals through voluntary muscle movement and motor imagery. We hope to generate enough empirical data to lay down the foundation for a targeted survey that will better test the results from our smaller scale experiments.
Goals
- The current goal for our project is identifying the types of physical movements that generate the best signals for the EEG. These brain signals are the basis for the project, and without a functional understanding of how they work and how to generate a clean, consistent, and coherent signal, progress for any of the sub-projects would be extremely difficult.
Equipment and Program
- For our experiments, a specialized EEG headset (Emotiv® EPOC Neuroheadset) is used. To transport and to analyze EEG signal data into the computer, Emotiv® Control Panel, BCI 2000® Cursor Task, BCI 2000® StimPresentation, and BCI 2000® Offline Analysis were used.
- For a more indepth view at our equipment setup go here
Experimental Design and Hypotheses
Experiment 1 (Cursor Task)
- This is the first experiment Tommy and DoHyun Kim performed. Without deep understanding of EEG signals, we chose several movements (Shoulder Rotation, Ankle Tapping, and Wrist Twisting). This was mostly an EEG signal training period for both of us.
Experiment 2 (LR StimPresentation)
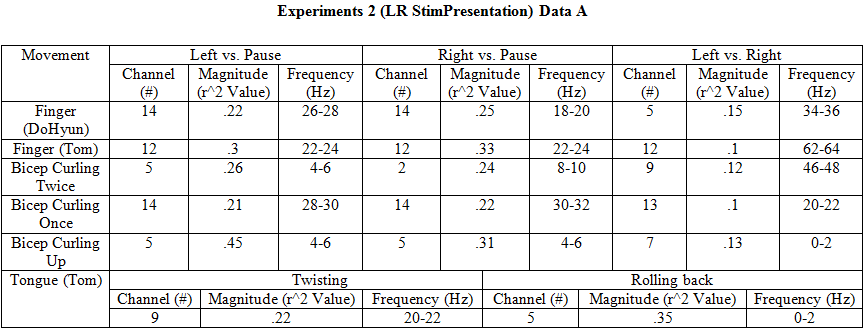
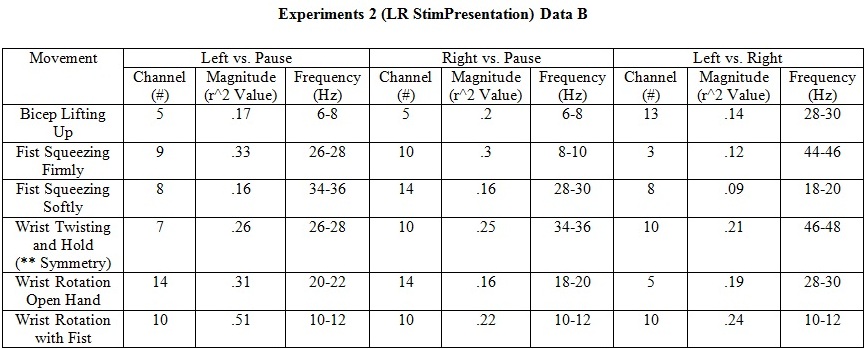
- The first LR StimPresentation experiment was for understanding general EEG signal properties of body movements. We performed EEG data collections for Finger Movements, Bicep Curling (with different velocity & force generated), Tongue Movements, Bicep Lifting, Fist Squeezing (both for passive and active force), Wrist Twisting, Wrist Holding, Wrist Rotation with Open Hand, and Wrist Rotation with Closed Fist. This series of EEG data collection gives us insight of possible hypothesis of our experiments.
Experiment 3 (Constant Action vs. Repetitive Action)
- This experiment was designed for determining whether Constant Holding will generate stronger R2 value than Repetitive Action for specific motion. Connecting Left hand Fingers and Wrist Twisting were performed for this test.
- Exp3map2.png
Tommy Powers Wrist Twist and Repeat (Left)
- Exp3map3.png
Tommy Powers Wrist Twist and Hold (Right)
- Exp3map4.png
Tommy Powers Wrist Twist and Repeat (Right)
Experiment 4 (Few Large Muscles vs. Many Small Muscles)
- This experiment was designed for determining whether EEG signals for Few Large Muscles will generate stronger R2 value than EEG signals for Many Small Muscles. Tom performed a StimPresentation test for comparing his EEG signals of Quad Muscle Contraction and Fist Squeezing.
Experiment 5 (Imaginary Action vs. Actual Action)
- This experiment is designed to explore the possibilities of using imaginary action generated EEG signals in real-time data acquisition. EEG data for Actual & Imaginary Bicep Curling and Fist Squeezing, EEG signal data for Imaginary 2D Ball Control, and EEG signal data for Visually Stimulated Imaginations were collected.
Experiment 6 (Eye Movements)
- This experiment was more likely an artifact test for Eye Movements. 2D Slow Eye Movements and Saccade Movements were performed for collecting EMG/EEG signals.
Experiment 7 (Trained Muscle Movement vs. Untrained Muscle Movement)
- There were significant differences in EEG data R2 values for Left vs. Right movements in Experiment 2. We made a hypothesis that motions for undeveloped side of brain or muscles will generate higher EEG data R2 values. In this experiment, we wrote specific letter (it was a mirror-imaged Korean word that Tom and I never wrote before) for collecting EEG signal data.
Experiment 8 (Directional Movements)
- From the Quantitative Physiology class, BME 301A, DoHyun Kim learned about directional properties of the ECoG signals inM1 sites. We tested arm movements with different directionality to confirm whether EEG signals also have directional properties for movements.
Analysis
Statistical Tests
Using the BCI 2000 StimPresentation tool, we collected data on various EEG signals of motor neuronal movement and artifacts. Each test consists of a combination of two successive StimPresentation runs.
We define the sample variance <math>S_p</math> to be:
<math>S_p = \frac{1}{n_1 + n_2 - 1}\left(\sum_{i=1}^{n_1}\left(x_i-\bar{x}\right)^2 + \sum_{i=1}^{n_2}\left(x_i-\bar{x}\right)^2\right)</math>
and the sample mean <math> \bar{x} </math> to be:
<math>\bar{x} = \frac{1}{n_1 + n_2}\left(\sum_{n=1}^{n_1}x_i + \sum_{n=1}^{n_2}x_i\right)</math>
By rearranging the terms, the "total variance" can be decomposed into two parts: the "explained variance" and the "unexplained variance."
<math> \underbrace{\frac{1}{n_1 + n_2 - 1}\sum_{i=1}^{n_1}\left(x_i-\bar{x}\right)^2}_{Total\ Variance}\ =\ \underbrace{\frac{1}{n_1 + n_2 - 1}\sum_{r=1}^2\sum_{i=1}^{n_r}\left(x_{ri}-\bar{x_r}\right)^2}_{Unexplained\ Variance}\ +\ \underbrace{\frac{1}{n_1 + n_2 - 1}\sum_{r=1}^2n_r\left(\bar{x_r}-\bar{x}\right)^2}_{Explained\ Variance} </math>
<math> R^2 </math> Coefficient of Determination Test
In statistics, the coefficient of determination, <math> R^2 </math>, is used to measure the how well a predictive model, i.e. a line of best fit, will accurately describe future behavior. Our data has two separate groups of data centered around <math> \bar{x_1} </math> and <math> \bar{x_2} </math>. The <math> R^2 </math> test calculates the <math> \frac{Explained\ Variance}{Total\ Variance} </math>, such that
<math> R^2\ =\ \frac{ \frac{\left(\sum_{i=1}^{n_1}x_{1i}\right)^2}{n_1}\, +\, \frac{\left(\sum_{i=1}^{n_2}x_{2i}\right)^2}{n_2}\, -\, G}{\sum_{i=1}^{n_1}x_{1i}^2\, +\, \sum_{i=1}^{n_2}x_{2i}^2} </math>
where
<math>G\ =\ \frac{\left(\sum_{i=1}^{n_1}x_{1i} + \sum_{i=1}^{n_2}x_{2i}\right)^2}{n_1 + n_2} </math>
F-test
An F-test is any statistical test in which the test statistic has an F-distribution under the null hypothesis. It is most often used when comparing statistical models that have been fit to a data set, in order to identify the model that best fits the population from which the data were sampled. The F-test calculates the <math> \frac{Explained\ Variance}{Unexplained\ Variance}\ =\ \frac{Inter-Group\ Variability}{Intra-Group\ Variability} </math>
<math> F\ =\ \frac{ \frac{\left(\sum_{i=1}^{n_1}x_{1i}\right)^2}{n_1}\, +\, \frac{\left(\sum_{i=1}^{n_2}x_{2i}\right)^2}{n_2}\, -\, G}{\sum_{i=1}^{n_1}x_{1i}^2\, +\, \sum_{i=1}^{n_2}x_{2i}^2\, -\, \left(\frac{\left(\sum_{i=1}^{n_1}x_{1i}\right)^2}{n_1}\, +\, \frac{\left(\sum_{i=1}^{n_2}x_{2i}\right)^2}{n_2}\right)}\left(n_1\, +\, n_2\, -\, 2\right) </math>
where
<math>G\ =\ \frac{\left(\sum_{i=1}^{n_1}x_{1i} + \sum_{i=1}^{n_2}x_{2i}\right)^2}{n_1 + n_2} </math>
ROC
Receiver Operating Characteristic (ROC) is a graphical plot of the sensitivity, or true positive rate, vs. false positive rate (1 − specificity or 1 − true negative rate) for a binary classifier system as its discrimination threshold is varied. The ROC can also be represented equivalently by plotting the fraction of true positives out of the positives (TPR = true positive rate) vs. the fraction of false positives out of the negatives (FPR = false positive rate). In our experiment, we could not change internal threshold setting for BCI2000. However, for the analysis of StimPresentation data, we chose α=0.01, where α is the probability of false positive, to get ROC values.
Cross Validation
Since we have three statistical tests that can be used for analysis of BCI EEG signal data, we used cross validation to determine which test is suitable for analyzing EEG signal data. From the offline analysis, we found that the shape of <math> R^2 </math> test and F test result are always same—the only difference is the magnitude of output that <math> R^2 </math> is normalized and bound by 0 to 1. Therefore, for the Cross Validation, four specific channels and frequencies are chosen: strong <math> R^2 </math> and strong ROC, strong <math> R^2 </math> and weak ROC, weak <math> R^2 </math> and strong ROC, and weak <math> R^2 </math> and weak ROC. Population of training was 41 trials while the population of test was 10 trials. The Cross Validation is calculated from individual MEM (Maximum Entropy Method) outputs of individual stimuli EEG signals.
As shown in Figure above, "strong <math> R^2 </math> and strong ROC" and ‘weak <math> R^2 </math> and strong ROC’ shows good results for the cross validation test. However, as we are looking for the signal that has distinguishable MEM outputs with a minimal variation, we conclude that one has to use signals from certain channels and frequencies that have strong <math> R^2 </math> and strong ROC values.
Adaptation to Cursor Task
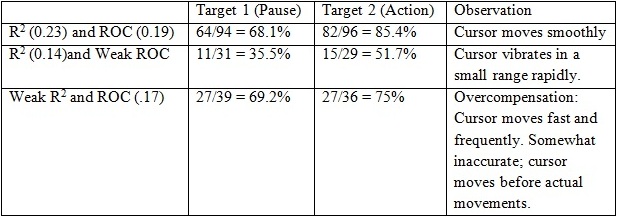
We performed Cursor Task experiments to observe the cursor movement for ‘both strong R2 and ROC’, ‘strong R2 and weak ROC’, and ‘weak R2 and strong ROC’ with modified Linear Classifiers for one specific channel and frequency giving weight=1.
Future
- In the immediate future, the 2D control group looks to continue the task of learning how to generate good data. We will continue to test our aforementioned hypotheses and potential new ones that arise, but as this fundamental question of how to generate good data starts to have a more definite answer, the group will move on to identifying two independent signals and implementing algorithms to add a second degree of control to the project.
References
- Anderson R Nicholas, Electrocorticographic Neural Correlates of Arm Movements and Associated GoalOrientation in Humans [1]
- Schalk, G.; McFarland, D.J.; Hinterberger, T.; Birbaumer, N; Wolpaw, J.R. BCI2000: A General Purpose Brain-Computer Interface (BCI) System. IEEE Transactions on Biomedical Engineering, Vol. 51, 6, 1034-1043 (2004)
- Wolpaw, J.R.; Birbaumer, N.; MacFarland, D.J.; Pfurtscheller, G.; Vaughn, T.M. Brain-computer interfaces for communication and control. Clinical Neurophysiology, 113, 767-791 (2002)
- Wolpaw, J. R.; McFarland, D. J. Control of a two-dimensional movement signal by a noninvasive brain-computer interface in humans. Proc. Natl Acad. Sci. USA 101, 17849–17854 (2004)
- “Wet Electrodes Placement” is adopted from: Washington University in St. Louis, BME301A Physical Lab Manual 3: Sensory Stimuli and the Electroencephalogram (EEG). [2]

