Difference between revisions of "Pointing Rotation"
| (3 intermediate revisions by the same user not shown) | |||
| Line 40: | Line 40: | ||
The result of this rotation is shown below in the figures where each red circle represents a point of possible localization for the system's particular physical parameters and sampling frequency. The figure on the left shows the system in the non-rotated state. On the right, rotation of both microphone pairs as shown. As was seen above, the density of the red circles increases at the region where these microphone pairs are most directly facing. With the rotations shown below this represents an increased resolution in the area relatively close to the microphones. | The result of this rotation is shown below in the figures where each red circle represents a point of possible localization for the system's particular physical parameters and sampling frequency. The figure on the left shows the system in the non-rotated state. On the right, rotation of both microphone pairs as shown. As was seen above, the density of the red circles increases at the region where these microphone pairs are most directly facing. With the rotations shown below this represents an increased resolution in the area relatively close to the microphones. | ||
| − | This ability of the system to function with this rotation of microphones extends directly from the linear case that was derived in the Project Overview section. Knowing the angle of rotation of each microphone pair, the system's angle of arrival algorithm will affectively shift the frame of reference of the geometry and in this way delays are interpreted in the rotated frame of reference. | + | This ability of the system to function with this rotation of microphones extends directly from the linear case that was derived in the [http://www.ese.wustl.edu/~nehorai/RaphaelZachary/students.cec.wustl.edu/_rms3/angle%20of%20arrival.htm Project Overview] section. Knowing the angle of rotation of each microphone pair, the system's angle of arrival algorithm will affectively shift the frame of reference of the geometry and in this way delays are interpreted in the rotated frame of reference. |
| − | + | The shift in reference frame can be illustrated with the following diagram. | |
| − | + | [[File: Rotatedparams.jpg|center]] | |
| − | Here the rotation of the microphone pair is represented by the angle . | + | Here the rotation of the microphone pair is represented by the angle <math>\alpha_1 </math>. The angle <math>\theta </math> represents the angle of arrival that the system would measure with respect to the rotated microphone pairs. The frame of reference shift can be accomplished by representing the effective angle of arrival with respect to the horizontal as <math>\theta_eff </math> and expressing it as <math>\theta_eff = \theta + \alpha</math> to take the rotation into account. <math>\theta_eff </math> would then be the effective angle used to estimate source position in the position estimation algorithm originally designed to be used for non-rotated microphone pairs. |
Latest revision as of 05:45, 6 May 2010
<sidebar>Robotic Sensing: Adaptive Robotic Control for Improved Acoustic Source Localization in 2D Nav</sidebar> Each of the microphone pairs individually can detect possible angles of arrival according to the time delay of arrival of the acoustic signal between the microphones of the pair. There is a limited number of potential angles which the system can estimate, which is a function of the physical parameters of distance between microphones of the pair and of the sampling frequency of the data acquisition set up. Each of these possible angles, <math>\theta \,</math>, can be found according to
<math> \theta = \cos^{-1}(\frac{v_s n}{d f_s}) </math>
where <math>v_s \,</math> represents the speed of sound, <math>f_s \,</math> represents sampling frequency, <math>d \,</math> represents the distance between microphones in a pair, and n is the discrete delay in samples between the microphones of the pair. The possible values of n are limited to the case where the entire expression,
<math> \frac{v_s n}{d f_s} </math>
which is within the <math>cos^{-1}</math> is greater than or equal to -1 and less than or equal to 1. In this way if <math>\alpha \,</math> is defined as,
<math>\alpha = \frac{v_s}{d f_s}</math>
For convenience we can express theta as <math> \theta = \cos^{-1}(\alpha n) \, </math>. Doing this, the possible integer values of n can be found when the following inequality is satisfied,
<math> -\frac{1}{\alpha} \leq n \leq \frac{1}{\alpha}</math>
Using our parameters of a sampling frequency of 44,100 Hz and a d parameter of 8 cm, n is limited to the integer number of 21 possible delays (in samples). These 21 possible delays correspond to 21 possible angles, resulting from the above expression ,
<math> \theta = \cos^{-1}(\frac{v_s n}{d f_s}) </math>
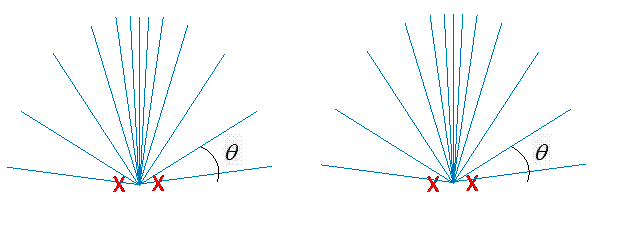
The following diagram illustrates this concept where each line represents a possible angle of arrival for one of the two microphone pairs (the red X figures).
The uneven spacing of the angles of arrival above is caused by the nonlinearity of the <math>cos^{-1}</math> term.
If one were to take both of the microphones of one of the pairs and rotate them (about their midpoints), it can be seen that this collection of possible angles, <math> \theta </math>, would be shifted by the given angle of rotation of the microphone pair. This could be applied to the case for any possible angle of rotation for either or both of the microphone pairs.
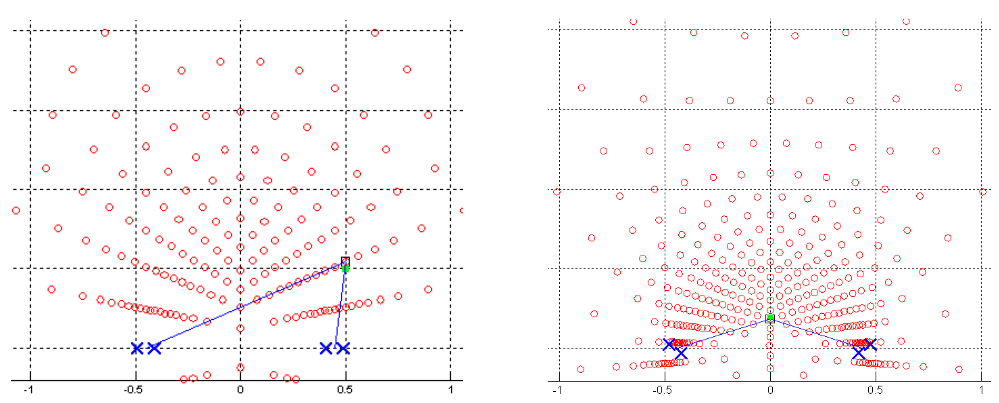
Shifting the microphone pairs in this way is particularly useful because of the unevenness of the possible angles of arrival diagramed above. That is, the region directly in front of each microphone pair ( <math> \theta = 90</math>) has a higher density of possible angles of arrival. Pointing this higher density of possible angles of arrival towards a sound source would then increase the local resolution around the sound source. In this way an adaptive system could rotate the microphone pairs so that they face the source and by doing this the accuracy of estimation could improve significantly.
The result of this rotation is shown below in the figures where each red circle represents a point of possible localization for the system's particular physical parameters and sampling frequency. The figure on the left shows the system in the non-rotated state. On the right, rotation of both microphone pairs as shown. As was seen above, the density of the red circles increases at the region where these microphone pairs are most directly facing. With the rotations shown below this represents an increased resolution in the area relatively close to the microphones.
This ability of the system to function with this rotation of microphones extends directly from the linear case that was derived in the Project Overview section. Knowing the angle of rotation of each microphone pair, the system's angle of arrival algorithm will affectively shift the frame of reference of the geometry and in this way delays are interpreted in the rotated frame of reference.
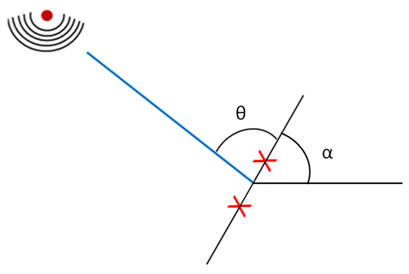
The shift in reference frame can be illustrated with the following diagram.
Here the rotation of the microphone pair is represented by the angle <math>\alpha_1 </math>. The angle <math>\theta </math> represents the angle of arrival that the system would measure with respect to the rotated microphone pairs. The frame of reference shift can be accomplished by representing the effective angle of arrival with respect to the horizontal as <math>\theta_eff </math> and expressing it as <math>\theta_eff = \theta + \alpha</math> to take the rotation into account. <math>\theta_eff </math> would then be the effective angle used to estimate source position in the position estimation algorithm originally designed to be used for non-rotated microphone pairs.


