Difference between revisions of "The Experimental Setup"
ChuckHolmes (talk | contribs) |
ChuckHolmes (talk | contribs) |
||
| Line 8: | Line 8: | ||
<br> | <br> | ||
| − | Also seen in Figure 2 are thermocouples inserted into the tissue. A clearer view of the thermocouples can be seen in Figure | + | Also seen in Figure 2 are thermocouples inserted into the tissue. A clearer view of the thermocouples can be seen in Figure 3. These thermocouple attached to a DATAQ device, seen in Figure 5. This device is used to acquire temperature data from multiple (up to 8) channels via thermocouple. |
| − | <br> | + | |
| + | Also, This system measures the temperature in the tissue from 4 different channels and at the same time measures temperature from two points in the water bath. | ||
| + | <br><br> | ||
[[File:Tcs.jpg|350px]] | [[File:Tcs.jpg|350px]] | ||
Revision as of 03:07, 12 May 2011
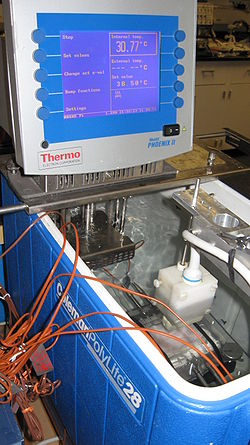
The methods of this work involved the measurement of temperature and synchronous ultrasonic imaging of tissue in a water bath. The tissue was usually a piece of turkey purchased from a local grocery store or a piece of preserved rabbit liver. The tissue was placed in experimental housing as seen in Figure 1. This housing was then placed in a water bath in an insulated container, as seen in Figure 2.
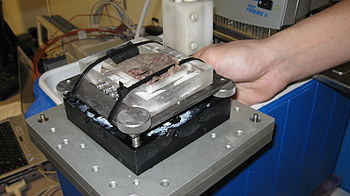
Figure 1 - The tissue placed in it experimental housing
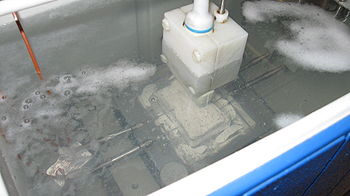
Figure 2 - The housing placed in the heated water bath
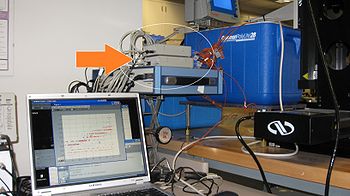
Also seen in Figure 2 are thermocouples inserted into the tissue. A clearer view of the thermocouples can be seen in Figure 3. These thermocouple attached to a DATAQ device, seen in Figure 5. This device is used to acquire temperature data from multiple (up to 8) channels via thermocouple.
Also, This system measures the temperature in the tissue from 4 different channels and at the same time measures temperature from two points in the water bath.
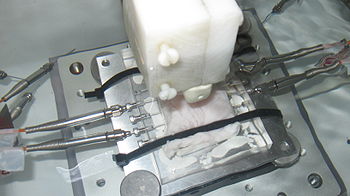
Figure 3 - The housing placed in the water bath with a clear view of the thermocouples
