Difference between revisions of "SatImg Output"
From ESE497 Wiki
Jump to navigationJump to search (→Output) |
(→Output) |
||
| Line 4: | Line 4: | ||
The output of the simulation shows a 3D graph with the location of the camera with respect to the Earth in the upper left, the image the camera took in the upper right, and the original image with center of the image marked with a point on the bottom. | The output of the simulation shows a 3D graph with the location of the camera with respect to the Earth in the upper left, the image the camera took in the upper right, and the original image with center of the image marked with a point on the bottom. | ||
| − | <gallery widths=400px heights=350px> | + | <gallery widths=400px heights=350px perrow=2> |
File:SatImg_1.jpg|First output from a run where the satellite starts near India and moves south and west. | File:SatImg_1.jpg|First output from a run where the satellite starts near India and moves south and west. | ||
File:SatImg_2.jpg|Second output from a run where the satellite starts near India and moves south and west. At this point the satellite is off the east coast of Africa. | File:SatImg_2.jpg|Second output from a run where the satellite starts near India and moves south and west. At this point the satellite is off the east coast of Africa. | ||
Latest revision as of 19:10, 11 May 2011
<sidebar>SatImg Report Nav</sidebar>
Output
The output of the simulation shows a 3D graph with the location of the camera with respect to the Earth in the upper left, the image the camera took in the upper right, and the original image with center of the image marked with a point on the bottom.
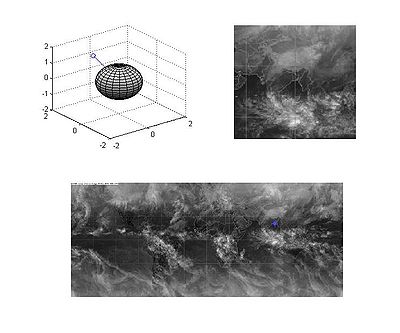
First output from a run where the satellite starts near India and moves south and west.
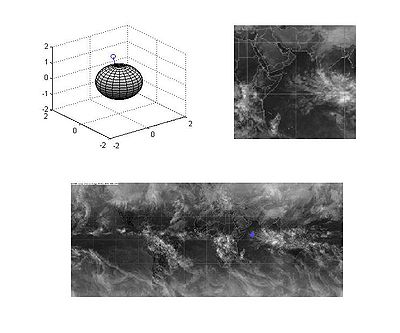
Second output from a run where the satellite starts near India and moves south and west. At this point the satellite is off the east coast of Africa.
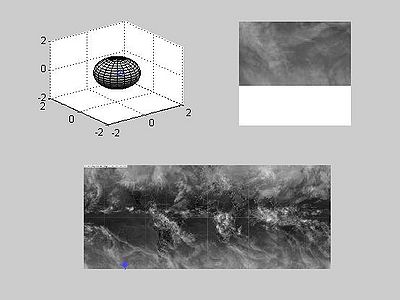
Example of an output where we want information from an area the original image does not cover. This area is displayed in white.
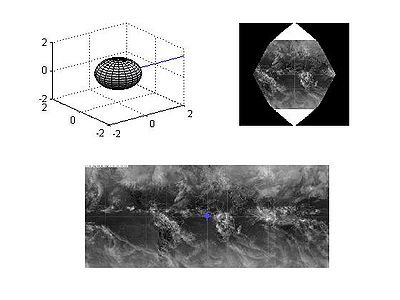
Example of an output where some of the image is of space. This is displayed in black.


