Difference between revisions of "Final Report.docx"
| (2 intermediate revisions by the same user not shown) | |||
| Line 21: | Line 21: | ||
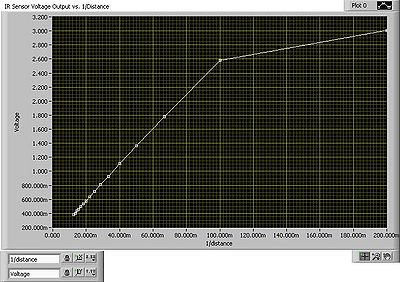
Fig. 1. Linear relationship between output voltage and distance. | Fig. 1. Linear relationship between output voltage and distance. | ||
| − | + | A block diagram of the labView code used to create the digital map is shown in Fig. 1. | |
| − | |||
| − | |||
| − | |||
| − | |||
| + | [[File:blockdiagram.JPG|400px|Block_Diagram]] | ||
Fig. 2. General block diagram of the creation of the digital map | Fig. 2. General block diagram of the creation of the digital map | ||
| Line 43: | Line 40: | ||
L. M. Goldman thanks Ed Richter, William Feero, Phani Chavali, Raphael Schwartz, and Zachary Knudson for their time and help with this project. | L. M. Goldman thanks Ed Richter, William Feero, Phani Chavali, Raphael Schwartz, and Zachary Knudson for their time and help with this project. | ||
| + | |||
References | References | ||
| − | + | [1] © Sharp Corporation Sheet No.: E4-A00201EN | |
Latest revision as of 20:04, 21 December 2010
Distance Sensing with Infrared Sensors
Lisa Goldman Supervisor: Dr. Arye Nehorai
Department of Electrical and Systems Engineering Washington University in St. Louis Fall 2010
Abstract—In this project, Sharp infrared distance sensors, with a 10 to 80 cm range of sight, were mounted on the sbRIO robot and used to create a digital map of the robot’s environment. I designed a circuit to convert the sensor’s voltage output and direction of measurement to a graphical representation, in essence creating a two-dimensional map of the robot’s surroundings.
Introduction
The goal of this project was to use infrared sensors to estimate the distances of obstacles in a robot’s immediate surroundings. The Sharp GP2Y0A21YK0F distance sensors emit infrared waves, which reflect off any obstacles within 10 to 80 cm, and are processed by the sensor’s receiver. The sensor then uses the method of triangulation to output a specific voltage that corresponds to the obstacle’s proximity [1]. My task was to correlate the voltage outputs to the distance of the obstacle, and to plot all measurements taken in an easy to read manner. With this information, the robot can move about a room, either autonomously or guided by a user’s commands, avoiding the obstacles it has observed. Design Overview Before considering any application of the infrared sensors, the first step was to find the best fit for the correlation between the sensor’s output voltage and the true distance of an object in front of it. Using a blank sheet of white paper for its high reflectance, the sensor’s voltage outputs were charted against preset distances ranging from 10 to 80 cm, in increments of 5 cm. A roughly linear relationship resulted, as shown in Fig. 1. Note that the rightmost data point that disrupts the linearity of the curve corresponds to a distance that is out of the specified range of the sensor, and therefore was deleted.
Fig. 1. Linear relationship between output voltage and distance.
A block diagram of the labView code used to create the digital map is shown in Fig. 1.
Fig. 2. General block diagram of the creation of the digital map
The next step involved how to mount the sensor on the sbRIO robot to most effectively map its surroundings. There proved to be two options: mount the sensor in a stationary fashion, or mount it on the robot’s servo motor. If the first alternative was chosen, the robot itself would have to move before each new sensor reading could be taken. If the latter alternative was chosen, the robot could remain stationary while the sensor scanned and measured 180˚ of the path in front of it. The first alternative ultimately proved impractical, as the robot would have very little data about its surroundings before it was forced to move, thereby greatly increasing the likelihood that it would crash into an obstacle.
Operation/Testing/Verification
The calibration phase was tested using the NI-ELVIS circuit board to power the device and interact with the computer. This process worked from the beginning. The testing of the final orientation of the sensor on the sbRIO robot is still incomplete. Initial tests to interface with the robot’s FPGA were either unsuccessful or noisy. Further tests will be conducted to determine if the problem lies with loose connections on the hardware, or with a glitch in the code.
Discussion/Conclusions
Because the testing phase is incomplete, it is difficult to determine if the design itself is flawed. After further testing, analysis and updates of the design can be made. In upcoming semesters, once the kinks in the project so far have been worked out, the next step will be to interface with the servo motor to predetermine the sensor’s range of scanning. Further applications could involve developing an algorithm so the robot could move about a room autonomously without bumping into obstacles. It would process the sensor’s data, and move in a direction without an obstacle, continuously surveying the surroundings and updating the digital map. Once this is complete, the final stage, applying the same techniques for a three dimensional map, can be completed. During the course of my undergraduate research project, I learned how the inner workings of emitters and imagers function, and how variations of reflectance affect a sensor’s performance. More importantly, I learned the process of engineering a design; how to adapt initial ideas and conceptions to accommodate the physics of the real world. I learned that successful engineering is heavily dependent on initial failures, and subsequent learning. Acknowledgment
L. M. Goldman thanks Ed Richter, William Feero, Phani Chavali, Raphael Schwartz, and Zachary Knudson for their time and help with this project.
References
[1] © Sharp Corporation Sheet No.: E4-A00201EN

