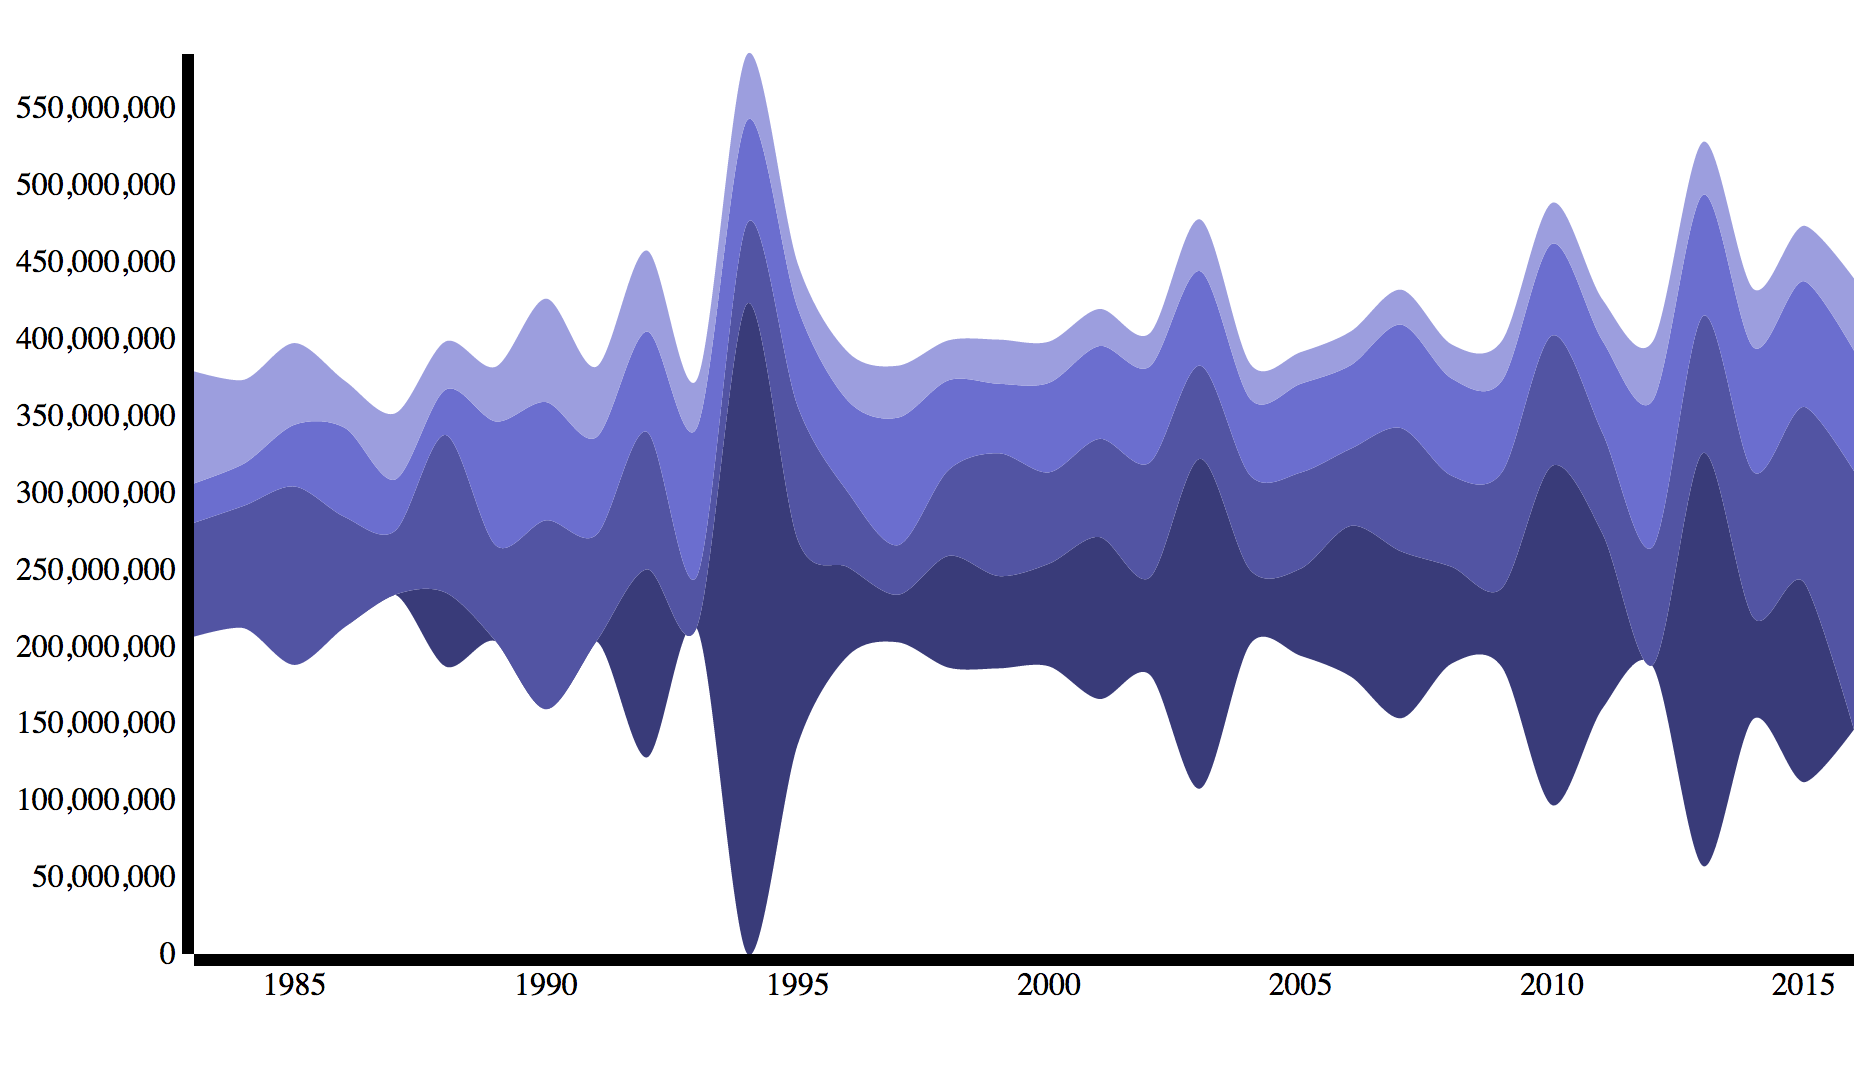
ThemeRiver Tutorial
adopted from: D3 wiki and D3 4.0 API Reference

About the Stack Layout
The stack layout takes a two-dimensional array of data and computes a baseline; the baseline is then propagated to the above layers, so as to produce a stacked graph. Several baseline algorithms are supported, along with sorting heuristics to improve perception, as described in "Stacked Graphs-Geometry & Aesthetics" by Byron & Wattenberg.
The stack layout operates in an arbitrary two-dimensional x and y coordinate space, similar to D3's other layouts, including tree. Thus, layers can be stacked vertically, horizontally, or even radially. While the "zero" offset is the default, a streamgraph can be generated using the "wiggle" offset, which attempts to minimize change in slope weighted by layer thickness.
# d3.stack()
Constructs a new stack layout with the default settings
# stack(data[, arguments...])
Generates a stack for the given array of data, returning an array representing each series. Any additional arguments are arbitrary; they are simply propagated to accessors along with the this object.
The series are determined by the keys accessor; each series i in the returned array corresponds to the ith key. Each series is an array of points, where each point j corresponds to the jth element in the input data. Lastly, each point is represented as an array [y0, y1] where y0 is the lower value (baseline) and y1 is the upper value (topline); the difference between y0 and y1 corresponds to the computed value for this point. The key for each series is available as series.key, and the index as series.index. The input data element for each point is available as point.data.
For example, consider the following table representing monthly sales of fruits:
| Month | Apples | Bananas | Cherries | Dates |
|---|---|---|---|---|
| 1/2015 | 3840 | 1920 | 960 | 400 |
| 2/2015 | 1600 | 1440 | 960 | 400 |
| 3/2015 | 640 | 960 | 640 | 400 |
| 4/2015 | 320 | 480 | 640 | 400 |
This might be represented in JavaScript as an array of objects:
var data = [
  {month: new Date(2015, 0, 1), apples: 3840, bananas: 1920, cherries: 960, dates: 400},
  {month: new Date(2015, 1, 1), apples: 1600, bananas: 1440, cherries: 960, dates: 400},
  {month: new Date(2015, 2, 1), apples:  640, bananas:  960, cherries: 640, dates: 400},
  {month: new Date(2015, 3, 1), apples:  320, bananas:  480, cherries: 640, dates: 400}
];
To produce a stack for this data:
var stack = d3.stack()
    .keys(["apples", "bananas", "cherries", "dates"])
    .order(d3.stackOrderNone)
    .offset(d3.stackOffsetNone);

var layers = stack(data);
The resulting array has one element per series. Each series has one point per month, and each point has a lower and upper value defining the baseline and topline:
[
  [[   0, 3840], [   0, 1600], [   0,  640], [   0,  320]], // apples
  [[3840, 5760], [1600, 3040], [ 640, 1600], [ 320,  800]], // bananas
  [[5760, 6720], [3040, 4000], [1600, 2240], [ 800, 1440]], // cherries
  [[6720, 7120], [4000, 4400], [2240, 2640], [1440, 1840]], // dates
]
Creating the ThemeRiver
- Set up canvas
- Read in data
- Get keys from data
- Calculate min and max data values.
- Define x-scale and y-scale using the calulated min and max values when deining the domain
- Use the stack layout to calculate the basline values
- Define area generator # d3.area()
- Draw themeRiver
- Add svg paths
- Bind data for each layer to paths
- Use area to set the d attribute for each layer
Define width and height variables and your svg.
["apples", "bananas", "cherries", "dates"]
X min and max For the example dataset above, you will need to find the earliest year and the most recent year for recorded sales
Y max Maximal value for total sales (sum of all fruits) of each year
var layers = stack(data);