
You can animate a deformed, contour, symbol, or material orientation (time history animation only) plot using one of the following:
Time History Animation
In a time history animation ABAQUS displays each frame of each step from the output database in sequence, and you can see the change in the deformation or the change in a contour or symbol plot variable while the analysis progresses. In effect, ABAQUS animates the results of the analysis. You can select which steps and frames to include in a time history animation.
Scale Factor Animation
Scale factor animation takes the results from a selected step and frame and simply scales them to form frames of the animation. You can select a scale factor that varies between zero and one or between minus one and plus one. Scale factor animation is particularly useful for animating vibration modes computed by an eigenvalue analysis.
The animation uses the plot options from the relevant mode—deformed, contour, symbol, or material orientation. In addition, you can control the following:
The speed of the animation
Whether the animation runs continuously or just once
Whether to display the animation status
For the elastomeric foam example you will display a time history animation of a contour plot. The animated contour plot displays the variable you selected from the Field Output dialog box (LE22). In addition, it uses the same options that you selected for the contour plot; for example, the contour intervals and element edge display.
To animate the contour plot:
From the main menu bar, select Animate![]() Time History.
Time History.
ABAQUS displays the customized contour plot at the beginning of the analysis and steps through each frame; the state block indicates the current step and increment throughout the animation. After the last increment of the last step, the animation restarts at the beginning of the analysis (Step 1, Increment 0, and Step Time = 0.00).
ABAQUS also displays the movie player controls on the right side of the context bar:
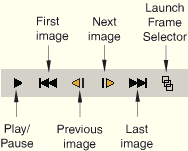
In the context bar, click the Play/Pause button to stop the animation.
The animation stops at the current image.
Click the button again to continue the animation.
The animation resumes.
From the main menu bar, select Options![]() Animation to view the animation options.
Animation to view the animation options.
ABAQUS displays the Animation Options dialog box.
Click the Player tab if it is not already selected, and do the following:
Choose Swing.
Click OK.
Because you chose Swing, when the animation reaches the end of the analysis, it steps backward through each frame instead of jumping back to the beginning of the analysis.
You can also customize the contour plot while the animation is running.
Display the Contour Plot Options dialog box.
Reduce the number of contour intervals to 10.
Click OK to apply your change and to close the Contour Plot Options dialog box.
When you have finished viewing the animation, click the Play/Pause button to stop the movie.